- マーケット分析
- テクニカル分析
フランス40指数 テクニカル分析 - フランス40指数 取引:2019-08-05
New US sanctions against China caused the fall of global stock markets
The French industrial PMI dropped in July. Will the decline of FR40 quotations continue?
The French macroeconomic indicator Markit Manufacturing PMI in July this year dropped to 49.7 points. This is worse than a preliminary forecast of 50 points. In general, the global stock markets are experiencing a decrease in quotations against the background of another exacerbation of the US-Chinese trade war. US President Donald Trump announced a duty increase of 10% from September 1, 2019 on imports of Chinese goods worth $ 300 billion a year. The fall of the FR40 index last week was the maximum since October 2018. The current P / E level (capitalization / total net profit for the year) of the index is 17.5. He is now 13.3% higher than the level at the beginning of 2019.
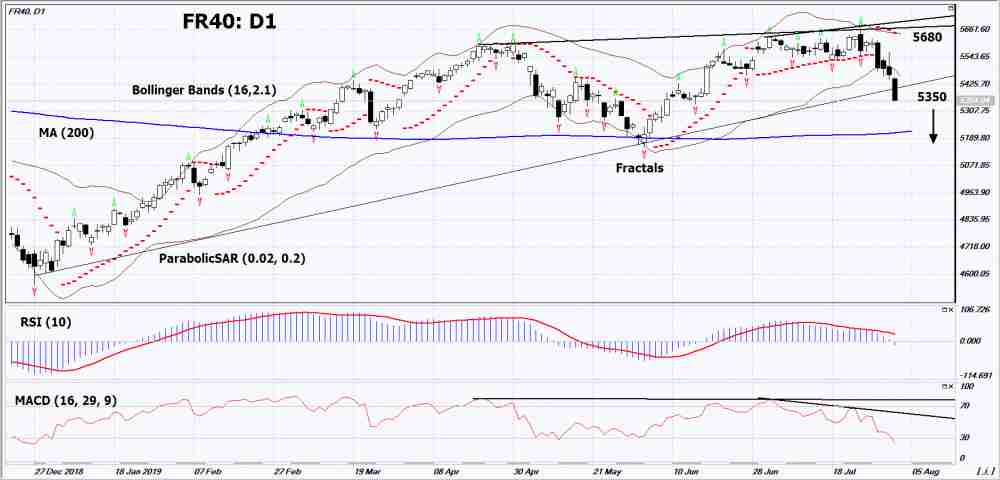
On the daily timeframe FR40: D1 broke through the support line of the medium-term uptrend. A number of technical analysis indicators formed signals for lowering. A further drop in quotations is possible in case of worsening trade wars and their negative impact on the world and French economies.
- The Parabolic indicator gives a downtrend signal.
- The Bolinger bands widened, indicating a volatility increase. Both lines slope down.
- The RSI indicator is below 30. It formed a divergence towards to fall.
- The MACD indicator gives a bearish signal.
The bearish momentum may develop if FR40 drops below its last low: 5350. This level can be used as an entry point. The initial stop lose may be set higher than the last upper fractal, the maximum since December 2007, the upper Bollinger line and the Parabolic signal: 5680. After opening the pending order, stop shall be moved following the Bollinger and Parabolic signals to the next fractal minimum. Thus, we are changing the potential profit/loss to the breakeven point. More risk-averse traders may switch to the 4-hour chart after the trade and place a stop loss moving it in the direction of the trade. If the price meets the stop level (5680) without reaching the order (5350), we recommend to cancel the order: the market sustains internal changes that were not taken into account.
Technical Analysis Summary
| Position | Sell |
| Sell stop | Below 5350 |
| Stop loss | Above 5680 |
- コースを取って、

【重要な注意事項】:
本レポートは、当社の親会社であるアイエフシーマーケットが作成したものの邦訳です。本レポートには、当社のサービスと商品についての情報を含みますが、お客様の投資目的、財務状況、資金力にかかわらず、情報の提供のみを目的とするものであり、金融商品の勧誘、取引の推奨、売買の提案等を意図したものではありません。 本レポートは、アイエフシーマーケットが信頼できると思われる情報にもとづき作成したものですが、次の点に十分ご留意ください。アイエフシーマーケットおよび当社は、本レポートが提供する情報、分析、予測、取引戦略等の正確性、確実性、完全性、安全性等について一切の保証をしません。アイエフシーマーケットおよび当社は、本レポートを参考にした投資行動が利益を生んだり損失を回避したりすることを保証または約束あるいは言外に暗示するものではありません。アイエフシーマーケットおよび当社は、本レポートに含まれる不確実性、不正確性、不完全性、誤謬、文章上の誤り等に起因して、お客様または第三者が損害(直接的か間接的かを問いません。)を被った場合でも、一切の責任を負いません。
