- マーケット分析
- テクニカル分析
英国FT100指数 テクニカル分析 - 英国FT100指数 取引:2019-06-10
World central banks are going to support economic growth
The plans of the US Federal Reserve and the European Central Bank to continue monetary stimulation of their national economies lowered the risk of a global recession, which caused a significant increase in stock markets. Will the GB100 quotations continue growing?
The ECB is going to continue issuing the euro under the TLTRO program for a total of 2.6 trillion euros. In addition, it can lower the rate by 0.1% until the end of this year. According to the interest futures quotes, the probability of such an event is 70%. According to the ECB, these measures will accelerate economic growth in the Eurozone from 1.2% in 2019 to 1.4% in 2020/21. In the USA, weak labor market data (non-farm payrolls) for May was published. According to the quotation of interest futures on the Chicago stock exchange, the probability of a reduction in the Fed rate at a meeting on July 31, 2019 reached 85%. The FTSE 100 index is growing in line with the global trend. Additional positive impact on it may be the plans to conclude a separate trade agreement between the UK and the United States. Since the beginning of this year, the FTSE 100 has grown by 9%. This is less than the increase in such indices as DAX, CAC40, S & P500 and others.
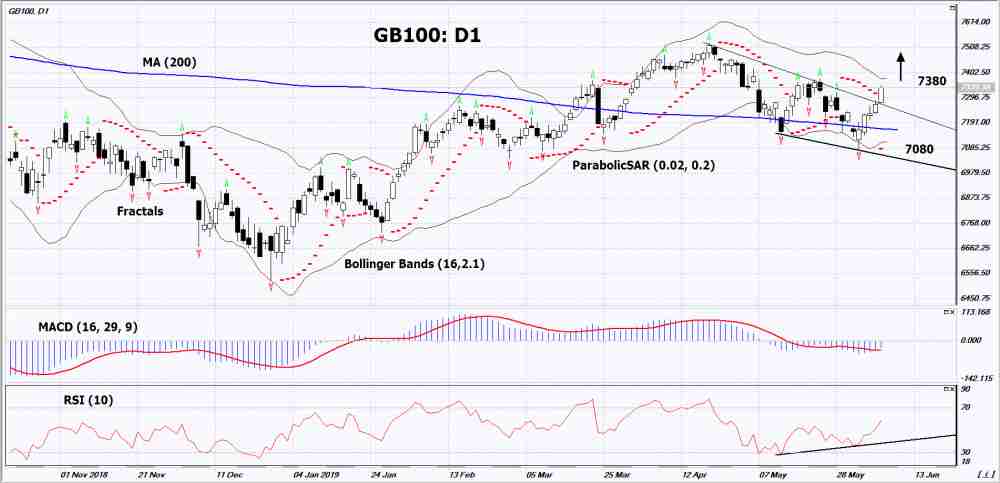
On the daily timeframe GB100: D1 broke up the resistance line of the downward channel. Various technical analysis indicators have generated uptrend signals. Further growth of quotations is possible in the event of a successful completion of Brexit and positive trade negotiations between the US and the UK.
- The Parabolic indicator shows an uptrend signal.
- The Bolinger Bands narrowed, indicating a volatility decrease. Both lines of Bollinger have a slope up
- The RSI indicator is above the 50 mark. It has formed a divergence to the increase.
- The MACD indicatorgives a buy signal.
The bullish momentum may develop in case if GB100 exceeds its last two fractals and the upper Bollinger line: 7380. This level may serve as an entry point. The initial stop loss may be placed below the last lower fractal, the bottom Bollinger line, the 200-day moving average line and the Parabolic signal: 7080. After opening the pending order, we shall move the stop to the next fractal low following the Bollinger and Parabolic signals. Thus, we are changing the potential profit/loss to the breakeven point. More risk-averse traders may switch to the 4-hour chart after the trade and place a stop loss moving it in the direction of the trade. If the price meets the stop level (7080) without reaching the order (7380), we recommend to cancel the order: the market sustains internal changes that were not taken into account.
Technical Analysis Summary
| Position | Buy |
| Buy stop | Above 7380 |
| Stop loss | Below 7080 |
- コースを取って、

【重要な注意事項】:
本レポートは、当社の親会社であるアイエフシーマーケットが作成したものの邦訳です。本レポートには、当社のサービスと商品についての情報を含みますが、お客様の投資目的、財務状況、資金力にかかわらず、情報の提供のみを目的とするものであり、金融商品の勧誘、取引の推奨、売買の提案等を意図したものではありません。 本レポートは、アイエフシーマーケットが信頼できると思われる情報にもとづき作成したものですが、次の点に十分ご留意ください。アイエフシーマーケットおよび当社は、本レポートが提供する情報、分析、予測、取引戦略等の正確性、確実性、完全性、安全性等について一切の保証をしません。アイエフシーマーケットおよび当社は、本レポートを参考にした投資行動が利益を生んだり損失を回避したりすることを保証または約束あるいは言外に暗示するものではありません。アイエフシーマーケットおよび当社は、本レポートに含まれる不確実性、不正確性、不完全性、誤謬、文章上の誤り等に起因して、お客様または第三者が損害(直接的か間接的かを問いません。)を被った場合でも、一切の責任を負いません。
