- マーケット分析
- テクニカル分析
GBP/CHF テクニカル分析 - GBP/CHF 取引:2019-07-03
Getting ready for the publication of statistics
Weak macroeconomic statistics was published in Switzerland. The British authorities are going to take measures to stimulate the economy. Wil the GBPCHF quotations grow?
Such a movement is observed when the British pound strengthens against the Swiss franc. Manufacturing PMI Industrial Business Index in Switzerland dropped in June to 47.7 points, which is the lowest since September 2015. Retail sales in May fell by 1.7% in annual terms. They are showing a continuous decline since last October. Swiss National Bank confirmed its determination to maintain a negative interest rate (-0.75%). The Bank of England is also concerned about signs of a slowdown in the already British economy. At the same time, along with the usual rate cut, it is considering options for economic incentives through tax cuts and government spending. It can support the pound. Note that the rate of the Bank of England is positive and is + 0.75%. On Thursday, July 4, significant inflation data for June will be released in Switzerland. In the UK, an important block of statistics will be published next week.
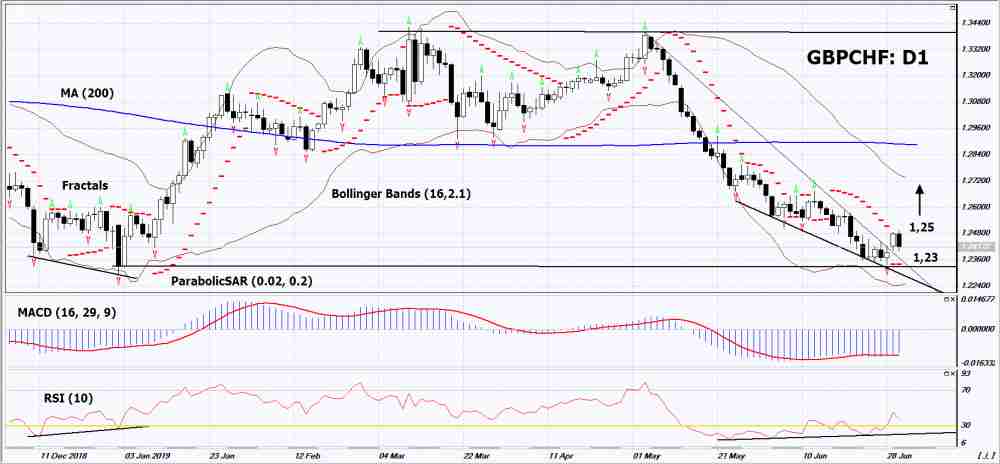
On the daily timeframe GBPCHF: D1 has reached the bottom of a wide, long-term neutral range, has pulled out of a downtrend and is trying to adjust upwards. Various technical analysis indicators have generated an uptrend signals. Further growth of quotations is possible in case of publication of positive macroeconomic indicators in the UK and negative ones in Switzerland.
- The Parabolic indicator indicates an uptrend signal.
- The Bolinger bands widened, indicating high volatility. Both lines of Bollinger have a slope up.
- The RSI indicator is above the 50 mark. It has formed a divergence to increase.
- The MACD indicator gives a bullish signal.
The bullish momentum may develop if GBPCHF exceeds its last maximum: 1.25. This level can be used as an entry point. The initial stop lose may be placed below the last lower fractal and the Parabolic signal: 1.23. After placing the pending order, the stop loss shall be moved following the signals of Bollinger and Parabolic to the next fractal minimum.Thus, we are changing the potential profit/loss to the breakeven point. More risk-averse traders may switch to the 4-hour chart after the trade and place a stop loss moving it in the direction of the trade. If the price meets the stop level (1,23) without reaching the order (1,25), we recommend to cancel the order: the market sustains internal changes that were not taken into account.
Technical Analysis Summary
| Position | Buy |
| Buy stop | Above 1,25 |
| Stop loss | Below 1,23 |
- コースを取って、

【重要な注意事項】:
本レポートは、当社の親会社であるアイエフシーマーケットが作成したものの邦訳です。本レポートには、当社のサービスと商品についての情報を含みますが、お客様の投資目的、財務状況、資金力にかかわらず、情報の提供のみを目的とするものであり、金融商品の勧誘、取引の推奨、売買の提案等を意図したものではありません。 本レポートは、アイエフシーマーケットが信頼できると思われる情報にもとづき作成したものですが、次の点に十分ご留意ください。アイエフシーマーケットおよび当社は、本レポートが提供する情報、分析、予測、取引戦略等の正確性、確実性、完全性、安全性等について一切の保証をしません。アイエフシーマーケットおよび当社は、本レポートを参考にした投資行動が利益を生んだり損失を回避したりすることを保証または約束あるいは言外に暗示するものではありません。アイエフシーマーケットおよび当社は、本レポートに含まれる不確実性、不正確性、不完全性、誤謬、文章上の誤り等に起因して、お客様または第三者が損害(直接的か間接的かを問いません。)を被った場合でも、一切の責任を負いません。
