- マーケット分析
- テクニカル分析
GBP/USD テクニカル分析 - GBP/USD 取引:2019-07-04
Slowing services sector in UK bearish for GBPUSD
UK’s service sector expansion slowed in June. Will the GBPUSD continue declining?
Economic data from UK were negative after the unrevised final reading of Q1 GDP confirmed economic growth was at the strongest pace since the third quarter of 2017. Purchasing managers index data released on Tuesday showed that UK construction activity suffered its sharpest downturn in over a decade in June. And a speech by Bank of England Chairman Mark Carney late Tuesday suggested that the bank might loosen the tightening bias of its monetary policy. At the same time Markit’s Service PMI index declined to 50.2 from 51 in May, showing a slowing of expansion in services sector. Readings above 50.0 indicate expansion. Weaker UK data are bearish for GBPUSD.
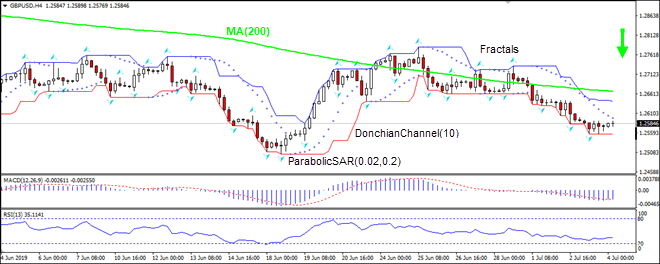
On the 4-hour timeframe the GBPUSD: H4 is retracing after hitting two-week low in mid-June.
- The Parabolic indicator gives a sell signal.
- The Donchian channel indicates downtrend: it is narrowing down.
- The MACD indicator gives a bullish signal: it is below the signal line and the gap is narrowing.
- The RSI oscillator is below the 50 level and has not breached into oversold zone yet.
We believe the bearish momentum will continue after the price breaches below lower boundary of Donchian channel at 1.2556. This level can be used as an entry point for placing a pending order to sell. The stop loss can be placed above the upper Donchian boundary at 1.2640. After placing the order, the stop loss is to be moved every day to the next fractal high, following Parabolic signals. Thus, we are changing the expected profit/loss ratio to the breakeven point. If the price meets the stop loss level (1.2640) without reaching the order (1.2556), we recommend cancelling the order: the market has undergone internal changes which were not taken into account.
Technical Analysis Summary
| Order | Sell |
| Sell stop | Below 1.2556 |
| Stop loss | Above 1.2640 |
- コースを取って、

【重要な注意事項】:
本レポートは、当社の親会社であるアイエフシーマーケットが作成したものの邦訳です。本レポートには、当社のサービスと商品についての情報を含みますが、お客様の投資目的、財務状況、資金力にかかわらず、情報の提供のみを目的とするものであり、金融商品の勧誘、取引の推奨、売買の提案等を意図したものではありません。 本レポートは、アイエフシーマーケットが信頼できると思われる情報にもとづき作成したものですが、次の点に十分ご留意ください。アイエフシーマーケットおよび当社は、本レポートが提供する情報、分析、予測、取引戦略等の正確性、確実性、完全性、安全性等について一切の保証をしません。アイエフシーマーケットおよび当社は、本レポートを参考にした投資行動が利益を生んだり損失を回避したりすることを保証または約束あるいは言外に暗示するものではありません。アイエフシーマーケットおよび当社は、本レポートに含まれる不確実性、不正確性、不完全性、誤謬、文章上の誤り等に起因して、お客様または第三者が損害(直接的か間接的かを問いません。)を被った場合でも、一切の責任を負いません。
