- マーケット分析
- テクニカル分析
香港株価指数 テクニカル分析 - 香港株価指数 取引:2019-02-01
Better than expected Chinese data bullish for HK50
Contraction in China’s manufacturing sector slowed while services sector expansion accelerated in January. Will the HK50 continue rising?
Latest Chinese economic data were better than expected: manufacturing contracted at slower pace and services sector expansion accelerated. The factory activity contraction slowed as the official Manufacturing PMI inched higher to 49.5 in January from 49.4 in the previous month when a decline to 49.3 was expected. At the same time the official Non-Manufacturing PMI in China increased from 53.8 in December to 54.7 in January, a four-month high. The services sector accounts for more than half of the Chinese economy. Better than expected Chinese economic data are bullish for Hong Kong stock index.
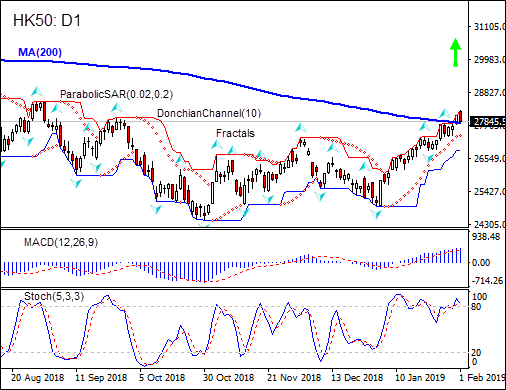
On the daily timeframe the HK50: D1 is retracing higher after hitting one-month low in the beginning of January. It is testing 200-day moving average MA(200)
- The Parabolic indicator gives a buy signal.
- The Donchian channel indicates uptrend: it is widening up.
- The MACD indicator gives a bullish signal: it is above the signal line and the gap is widening.
- The Stochastic oscillator is falling but is still in the overbought zone, this is bearish.
We believe the bullish momentum will continue after the price closes above the upper boundary of Donchian channel at 28208.0. This level can be used as an entry point for placing a pending order to buy. The stop loss can be placed below the lower Donchian boundary at 26832.0. After placing the order, the stop loss is to be moved every day to the next fractal low, following Parabolic signals. Thus, we are changing the expected profit/loss ratio to the breakeven point. If the price meets the stop loss level (26832) without reaching the order (28208), we recommend cancelling the order: the market has undergone internal changes which were not taken into account.
Technical Analysis Summary
| Position | Buy |
| Buy stop | Above 28208 |
| Stop loss | Below 26832 |
- コースを取って、

【重要な注意事項】:
本レポートは、当社の親会社であるアイエフシーマーケットが作成したものの邦訳です。本レポートには、当社のサービスと商品についての情報を含みますが、お客様の投資目的、財務状況、資金力にかかわらず、情報の提供のみを目的とするものであり、金融商品の勧誘、取引の推奨、売買の提案等を意図したものではありません。 本レポートは、アイエフシーマーケットが信頼できると思われる情報にもとづき作成したものですが、次の点に十分ご留意ください。アイエフシーマーケットおよび当社は、本レポートが提供する情報、分析、予測、取引戦略等の正確性、確実性、完全性、安全性等について一切の保証をしません。アイエフシーマーケットおよび当社は、本レポートを参考にした投資行動が利益を生んだり損失を回避したりすることを保証または約束あるいは言外に暗示するものではありません。アイエフシーマーケットおよび当社は、本レポートに含まれる不確実性、不正確性、不完全性、誤謬、文章上の誤り等に起因して、お客様または第三者が損害(直接的か間接的かを問いません。)を被った場合でも、一切の責任を負いません。
