- マーケット分析
- テクニカル分析
香港株価指数 テクニカル分析 - 香港株価指数 取引:2019-08-22
HK50 technical setup turns bullish
Hong Kong inflation remained steady in July while unemployment ticked up. Will the HK50 advance continue?
Hong Kong economic data have been weak on balance recently: unemployment ticked up to 2.9% in July from 2.8%, the Q2 GDP contraction was revised downward to 0.4% decline from 0.3% of advance reading. However foreign exchange reserves rose while inflation remained steady at 3.3% when a decline to 2.8% was forecast. All these data were recorded against the background of contraction in the private sector activities as evidenced by decline in Markit’s PMI to 43.8 from 47.9 in June: readings above 50.0 indicate sector expansion, and contraction below. Deteriorated US-China trade relations are main reason for slowing of activities. However technical indicators point to upside momentum for Hong Kong stock market. And unresolved US-China trade dispute remains a downside risk for Hong Kong stock market.
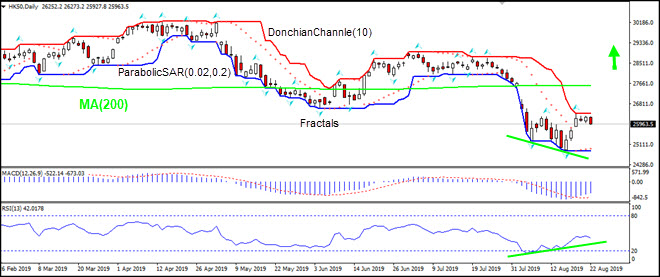
On the daily timeframe HK50: D1 is retracing higher after hitting 10-month low, still below the 200-day moving average MA(200), which is level.
- The Parabolic indicator has formed a buy signal.
- The Donchian channel indicates no trend yet: it is flat.
- The MACD indicator is below the signal line with the gap narrowing. This is a bullish signal.
- The RSI oscillator has not reached the overbought zone and has formed a bullish divergence.
We believe the bullish momentum will continue after the price breaches above the upper Donchian boundary at 26401.10. This level can be used as an entry point for placing a pending order to buy. The stop loss can be placed below the lower fractal at 24850.00. After placing the pending order the stop loss is to be moved every day to the next fractal low, following Parabolic signals. Thus, we are changing the expected profit/loss ratio to the breakeven point. If the price meets the stop-loss level (24850.00) without reaching the order (26401.10) we recommend cancelling the order: the market sustains internal changes which were not taken into account.
Technical Analysis Summary
| Order | Buy |
| Buy Stop | Above 26401.10 |
| Stop loss | Below 24850.00 |
- コースを取って、

【重要な注意事項】:
本レポートは、当社の親会社であるアイエフシーマーケットが作成したものの邦訳です。本レポートには、当社のサービスと商品についての情報を含みますが、お客様の投資目的、財務状況、資金力にかかわらず、情報の提供のみを目的とするものであり、金融商品の勧誘、取引の推奨、売買の提案等を意図したものではありません。 本レポートは、アイエフシーマーケットが信頼できると思われる情報にもとづき作成したものですが、次の点に十分ご留意ください。アイエフシーマーケットおよび当社は、本レポートが提供する情報、分析、予測、取引戦略等の正確性、確実性、完全性、安全性等について一切の保証をしません。アイエフシーマーケットおよび当社は、本レポートを参考にした投資行動が利益を生んだり損失を回避したりすることを保証または約束あるいは言外に暗示するものではありません。アイエフシーマーケットおよび当社は、本レポートに含まれる不確実性、不正確性、不完全性、誤謬、文章上の誤り等に起因して、お客様または第三者が損害(直接的か間接的かを問いません。)を被った場合でも、一切の責任を負いません。
