- マーケット分析
- テクニカル分析
家畜 テクニカル分析 - 家畜 取引:2019-02-05
China can reduce beef consumption
All India Meat & Livestock Exporters Association expects a decrease in global demand for Indian beef. Will LCATTLE prices fall?
According to the forecast of this association, beef exports from India in the 2018/19 agricultural season may be reduced by 15% to 1.15 million tons. This is the minimum since the 2012/13 agricultural season. The main reason is the tightening of sanitary norms on beef imports in China because of the fear of a pangolin epidemic. Vietnam can also cut Indian beef purchases. Amid this, India is going to increase the supply of meat to such countries as Iraq, Malaysia, Indonesia and Egypt. The reduction in demand in China and Vietnam has already provoked a decline in Indian beef prices from $3.2 thousand per ton to $2.9 thousand. An additional factor for the possible price decrease may be an increase in cattle meat exports from Brazil in January 2019 to 102.4 thousand tons, compared with 99.4 thousand tons in January 2018.
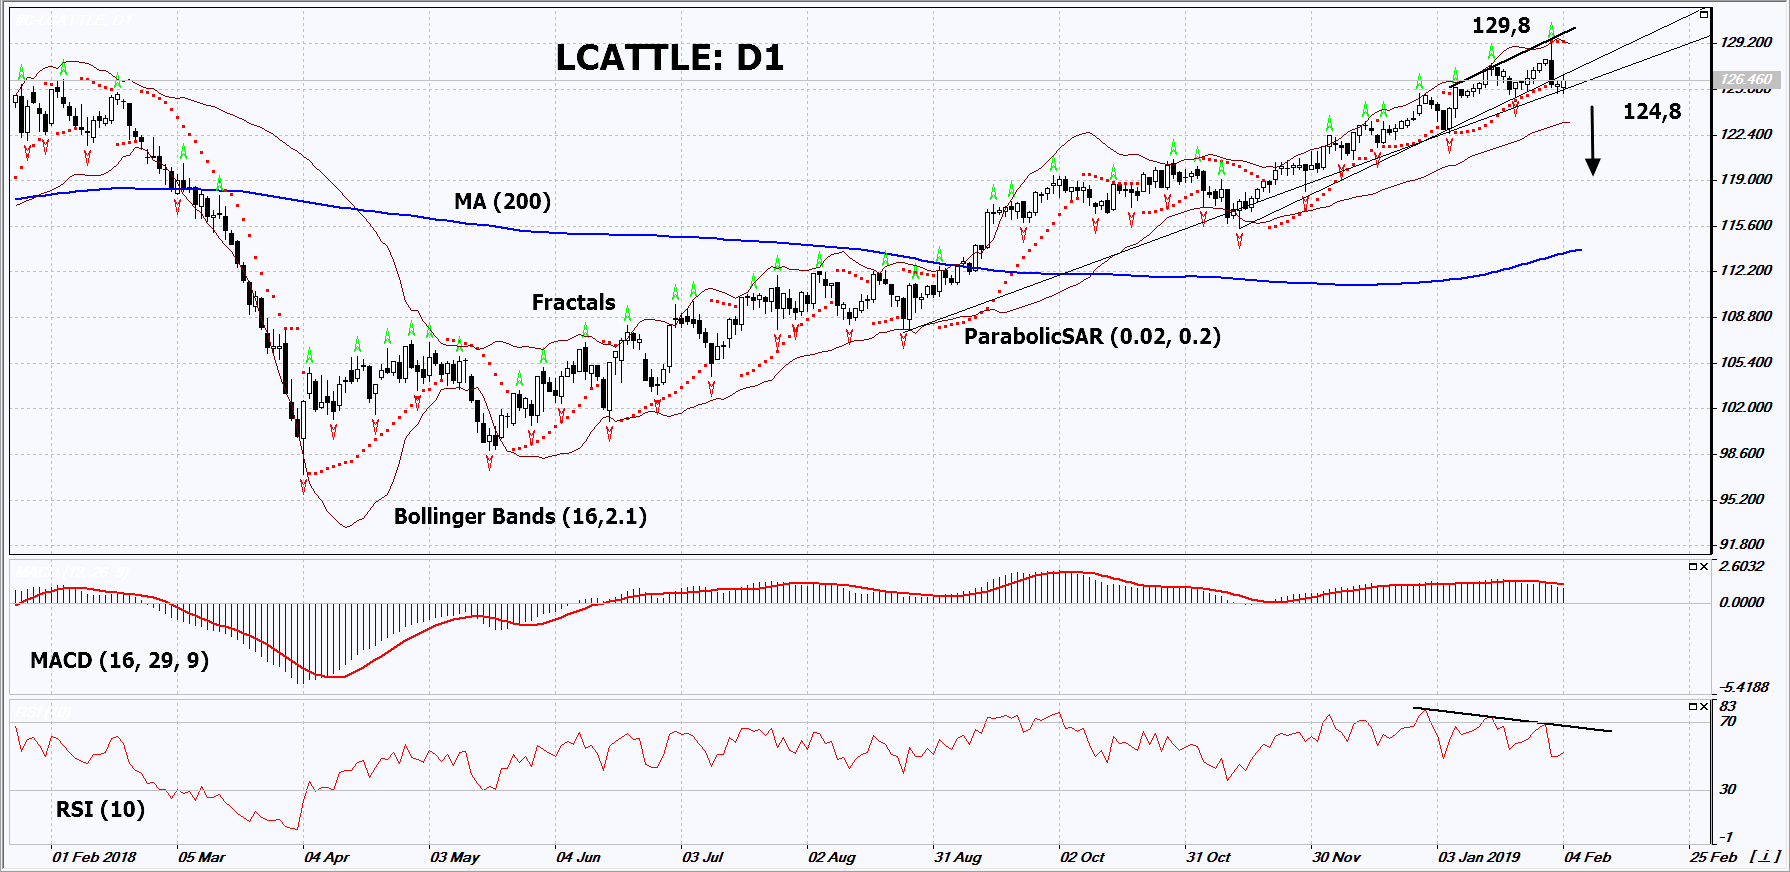
On the daily timeframe, LCATTLE: D1 has approached the support line of the uptrend. It should be breached down before opening a sell position. The price decrease is possible in case of a decline in global demand.
- The Parabolic indicator gives a bearish signal.
- The Bollinger bands have widened, which indicates high volatility. Both Bollinger bands are titled downwards
- The RSI indicator is near 50. It has formed a negative divergence.
- The MACD indicator gives a bearish signal.
The bearish momentum may develop in case LCATTLE falls below its last fractal low at 124.8. This level may serve as an entry point. The initial stop loss may be placed above the last fractal high, the high since November 2017, the upper Bollinger band and the Parabolic signal at 129.8. After opening the pending order, we shall move the stop to the next fractal low following the Bollinger and Parabolic signals. Thus, we are changing the potential profit/loss to the breakeven point. More risk-averse traders may switch to the 4-hour chart after the trade and place there a stop loss moving it in the direction of the trade. If the price meets the stop level (129.8) without reaching the order (124.8), we recommend to close the position: the market sustains internal changes that were not taken into account.
Summary of technical analysis
| Position | Sell |
| Sell stop | Below 124.8 |
| Stop loss | Above 129.8 |
- コースを取って、

【重要な注意事項】:
本レポートは、当社の親会社であるアイエフシーマーケットが作成したものの邦訳です。本レポートには、当社のサービスと商品についての情報を含みますが、お客様の投資目的、財務状況、資金力にかかわらず、情報の提供のみを目的とするものであり、金融商品の勧誘、取引の推奨、売買の提案等を意図したものではありません。 本レポートは、アイエフシーマーケットが信頼できると思われる情報にもとづき作成したものですが、次の点に十分ご留意ください。アイエフシーマーケットおよび当社は、本レポートが提供する情報、分析、予測、取引戦略等の正確性、確実性、完全性、安全性等について一切の保証をしません。アイエフシーマーケットおよび当社は、本レポートを参考にした投資行動が利益を生んだり損失を回避したりすることを保証または約束あるいは言外に暗示するものではありません。アイエフシーマーケットおよび当社は、本レポートに含まれる不確実性、不正確性、不完全性、誤謬、文章上の誤り等に起因して、お客様または第三者が損害(直接的か間接的かを問いません。)を被った場合でも、一切の責任を負いません。
