- マーケット分析
- テクニカル分析
天然ガス テクニカル分析 - 天然ガス 取引:2019-05-13
Exports for the liquefied natural gas of USA grow
Exports of liquefied natural gas (LNG) of the United States in 2018 increased by 61%. Will the NATGAS quotations grow?
Last year, the United States ranked 4th in the world in terms of LNG exports. On May 10, 2019, the United States increased import duties on Chinese goods worth $ 200 billion from 10% to 25%. Initially, this increase was planned on January 1, 2019. Thus, it was expected %. For sure China will respond. However, the export of American LNG is unlikely to suffer, since, basically, it falls on European countries. This week, LNG supplies abroad are more than 1.5 times higher than last year’s level. In addition, the reduction in exports to China is already taken into account in current quotes. In January-April 2019, only 2 tankers with American LNG were sent to China, whereas in the same period of 2018 there were 14. Compared to last year, gas production in the United States is now 10.5% more and total demand - so far only by 7%.The difference between the produced and used volumes of gas enters the reserves and increases them. However, natural gas reserves in the United States are 1.651 trillion cubic feet, which is 14.9% less than the 5-year average.
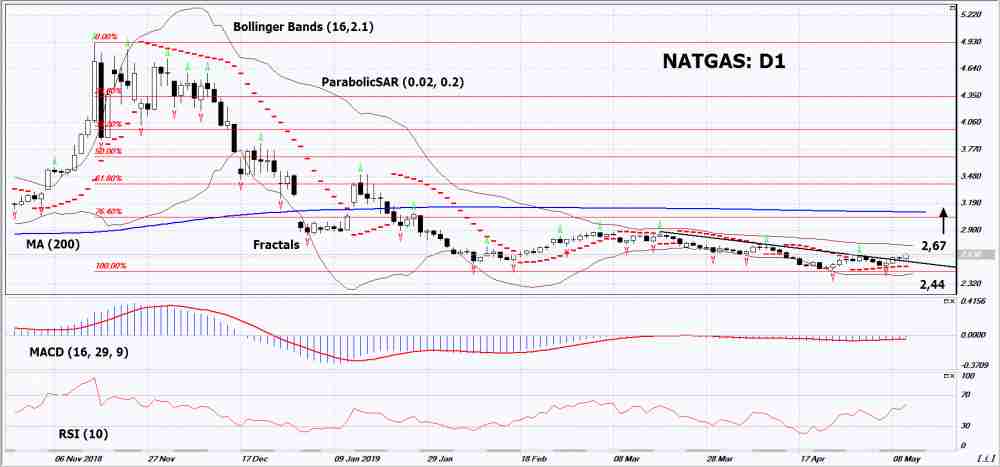
On a daily timeframe, Natgas: D1 пbroke up the downtrend resistance line and adjusted upward. Various technical analysis indicators have formed a signal of uptrend. Further growth of quotations is possible in case of an increase in demand in the USA.
- The Parabolic Indicatorshows a signal to increase.
- The Bollinger bands expanded, indicating high volatility. Both lines of Bollinger have a slope up.
- The RSI Indicator is above the 50 mark. There are no divergences.
- The MACD Indicatorshows a signal to increase.
The bullish momentum may develop if Natgas exceed its last maximum: 2.67. This level may serve as an entry point. The initial stop loss may be placed below the last two lower fractals, the bottom Bollinger line, the minimum since June 2016 and the Parabolic signal: 2.44. After opening the pending order, we shall move the stop to the next fractal low following the Bollinger and Parabolic signals to the next fractal minimum. Thus, we are changing the potential profit/loss to the breakeven point. More risk-averse traders may switch to the 4-hour chart after the trade and place there a stop loss moving it in the direction of the trade. If the price meets the stop level (2,44) without reaching the order (2,67), we recommend to close the position: the market sustains internal changes that were not taken into account.
Summary of technical analysis
| Position | Buy |
| Buy stop | Above 2,67 |
| Stop loss | Below 2,44 |
- コースを取って、

【重要な注意事項】:
本レポートは、当社の親会社であるアイエフシーマーケットが作成したものの邦訳です。本レポートには、当社のサービスと商品についての情報を含みますが、お客様の投資目的、財務状況、資金力にかかわらず、情報の提供のみを目的とするものであり、金融商品の勧誘、取引の推奨、売買の提案等を意図したものではありません。 本レポートは、アイエフシーマーケットが信頼できると思われる情報にもとづき作成したものですが、次の点に十分ご留意ください。アイエフシーマーケットおよび当社は、本レポートが提供する情報、分析、予測、取引戦略等の正確性、確実性、完全性、安全性等について一切の保証をしません。アイエフシーマーケットおよび当社は、本レポートを参考にした投資行動が利益を生んだり損失を回避したりすることを保証または約束あるいは言外に暗示するものではありません。アイエフシーマーケットおよび当社は、本レポートに含まれる不確実性、不正確性、不完全性、誤謬、文章上の誤り等に起因して、お客様または第三者が損害(直接的か間接的かを問いません。)を被った場合でも、一切の責任を負いません。
