- マーケット分析
- テクニカル分析
天然ガス テクニカル分析 - 天然ガス 取引:2019-08-19
The growth of gas reserves slowed down in the USA
The increase in US natural gas reserves over the week was less than expected. Will the NATGAS quotations grow?
According to U.S. Energy Information Administration (EIA), gas reserves for the week increased by 49 billion cubic feet with a forecast of 58 billion. As a result, gas reserves amounted to 2.738 trillion cubic feet, which is 3.9% lower than their average over the past 5 years. According to the EIA, over the past 12 months, total US gas supply has increased by 6% and total demand by 4.6%. The discrepancy is not very large, but at the same time, natural gas quotes are now a quarter lower than last year. They are near multi-year lows. Gas demand may increase amid large-scale plans to increase US exports of liquefied natural gas (LNG). Compared to last year, LNG deliveries abroad have already increased by 11%. US natural gas production is now at a historic high, but there is a risk of its decline. According to Baker Hughes, the number of operating drilling rigs in gas production in the United States has declined to a minimum since 2017 and amounted to 165 units.
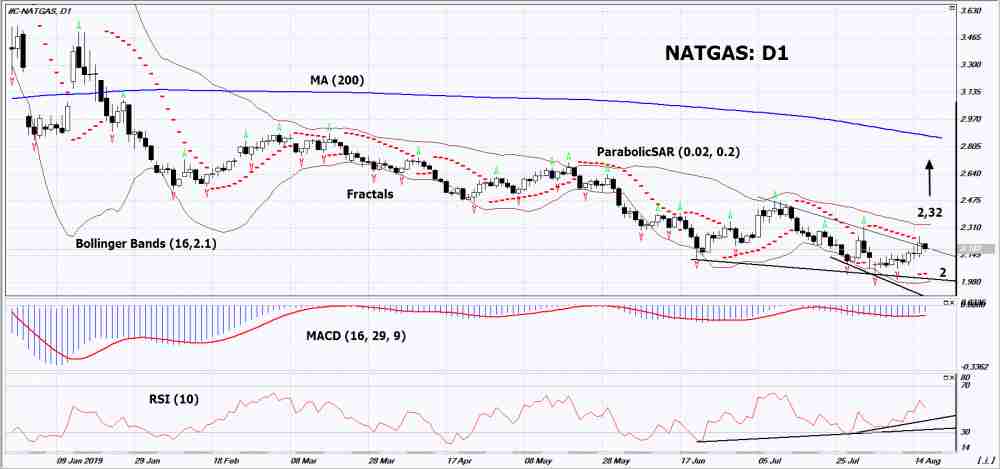
On the daily timeframe Natgas: D1 has broken up the resistance line of the downtrend and is adjusted up. Various technical analysis indicators have generated signals to increase. Further growth of quotations is possible in case of increased demand in the US and the massive closure of short positions.
- The Parabolic indicator demonstrates a signal to increase.
- The Bolinger bands narrowed, indicating a volatility decrease. Both Bollinger Lines Slope Up.
- The RSI indicator is above the 50 mark. It has formed a divergence to increase.
- The MACD indicator gives a bullish signal.
The bullish momentum may develop if Natgas exceeds its last upper fractal and the upper Bollinger line: 2.32. This level can be used as an entry point. The initial stop lose may be placed below the last two lower fractals, the lower Bollinger line, the minimum since April 2016 and the Parabolic signal: 2. After opening a pending order, the stop shall be moved following the Bollinger and Parabolic signals to the next fractal minimum. Thus, we are changing the potential profit/loss to the breakeven point. More risk-averse traders may switch to the 4-hour chart after the trade and place a stop loss moving it in the direction of the trade. If the price meets the stop level (2) without reaching the order (2,32), we recommend to cancel the order: the market sustains internal changes that were not taken into account.
Technical Analysis Summary
| Position | Buy |
| Buy stop | Above 2,32 |
| Stop loss | Below 2 |
- コースを取って、

【重要な注意事項】:
本レポートは、当社の親会社であるアイエフシーマーケットが作成したものの邦訳です。本レポートには、当社のサービスと商品についての情報を含みますが、お客様の投資目的、財務状況、資金力にかかわらず、情報の提供のみを目的とするものであり、金融商品の勧誘、取引の推奨、売買の提案等を意図したものではありません。 本レポートは、アイエフシーマーケットが信頼できると思われる情報にもとづき作成したものですが、次の点に十分ご留意ください。アイエフシーマーケットおよび当社は、本レポートが提供する情報、分析、予測、取引戦略等の正確性、確実性、完全性、安全性等について一切の保証をしません。アイエフシーマーケットおよび当社は、本レポートを参考にした投資行動が利益を生んだり損失を回避したりすることを保証または約束あるいは言外に暗示するものではありません。アイエフシーマーケットおよび当社は、本レポートに含まれる不確実性、不正確性、不完全性、誤謬、文章上の誤り等に起因して、お客様または第三者が損害(直接的か間接的かを問いません。)を被った場合でも、一切の責任を負いません。
