- マーケット分析
- テクニカル分析
NZD/CAD テクニカル分析 - NZD/CAD 取引:2019-10-09
Weak construction data is published in Canada
The number of housing starts in Canada decreased in September by 2.5% compared with August and amounted to 221.2 thousand. Will the NZDCAD quotations grow?
Such movement is observed with the strengthening of the New Zealand dollar and the weakening of the Canadian dollar. According to the Canadian Mortgage and Housing Corporation, the volume of new construction of individual urban houses decreased by 9%. Earlier, Canadian business activity indicator Ivey PMI for September fell to a minimum since March 2015 and amounted to 48.7 points. These negative factors may prompt the Bank of Canada to lower the rate at the next meeting on October 30, 2019. Now it is 1.75% with inflation of 1.9% in annual terms. September 11, Canada will release important labor market data for September. Preliminary forecasts are neutral. The US share in Canadian exports in August reached 75%. The main commodity is oil. Accordingly, the decline in world prices for it, as well as possible problems in the US-China trade negotiations, could adversely affect the dynamics of the Canadian dollar. The main trading partner of New Zealand is China and the dynamics of its currency will also depend on negotiations between the United States and China. A positive factor for the New Zealand dollar is government data on a reduction in net debt in the fiscal year 2019/20 to 19.2% of GDP, which is better than the forecast of 20%, as well as a budget surplus of NZ $ 7.5 billion.
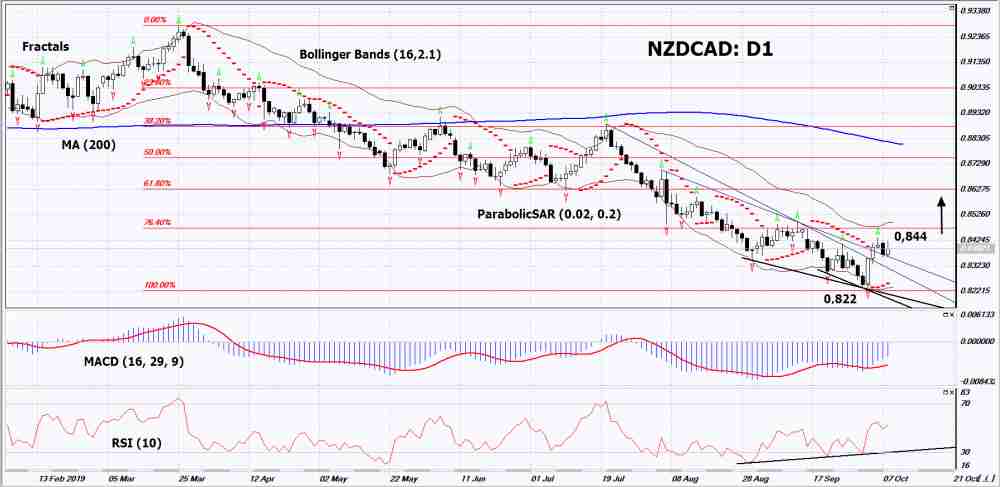
On the daily timeframe NZDCAD: D1 adjusts above from the minimum since April 2014. It has come out of a downtrend and various technical analysis indicators have formed signals to increase. Further growth of quotations is possible if positive macroeconomic data is published in New Zealand and negative - in Canada.
- The Parabolic indicator gives an uptrend signal.
- The Bolinger bands narrowed, indicating a volatility decrease. Both Bollinger Lines Slope Up.
- The RSI indicator is above the 50 mark. It has formed a double divergence to increase.
- The MACD indicator gives a bullish signal.
The bullish momentum may develop if NZDCAD exceeds its last upper fractal: 0.844. This level can be used as an entry point. The initial stop lose may be placed below the minimum since April 2014, the lower Bollinger line, the Parabolic signal and the last lower fractal: 0.822. After opening the pending order, the stop shall be moved following the Bollinger and Parabolic signals to the next fractal minimum. Thus, we are changing the potential profit/loss to the breakeven point. More risk-averse traders may switch to the 4-hour chart after the trade and place a stop loss moving it in the direction of the trade. If the price meets the stop level (0,822) without reaching the order (0,844), we recommend to cancel the order: the market sustains internal changes that were not taken into account.
Technical Analysis Summary
| Position | Buy |
| Buy stop | Above 0,844 |
| Stop loss | Below 0,822 |
- コースを取って、

【重要な注意事項】:
本レポートは、当社の親会社であるアイエフシーマーケットが作成したものの邦訳です。本レポートには、当社のサービスと商品についての情報を含みますが、お客様の投資目的、財務状況、資金力にかかわらず、情報の提供のみを目的とするものであり、金融商品の勧誘、取引の推奨、売買の提案等を意図したものではありません。 本レポートは、アイエフシーマーケットが信頼できると思われる情報にもとづき作成したものですが、次の点に十分ご留意ください。アイエフシーマーケットおよび当社は、本レポートが提供する情報、分析、予測、取引戦略等の正確性、確実性、完全性、安全性等について一切の保証をしません。アイエフシーマーケットおよび当社は、本レポートを参考にした投資行動が利益を生んだり損失を回避したりすることを保証または約束あるいは言外に暗示するものではありません。アイエフシーマーケットおよび当社は、本レポートに含まれる不確実性、不正確性、不完全性、誤謬、文章上の誤り等に起因して、お客様または第三者が損害(直接的か間接的かを問いません。)を被った場合でも、一切の責任を負いません。
