- マーケット分析
- テクニカル分析
原油対天然ガス テクニカル分析 - 原油対天然ガス 取引:2018-11-28
OPEC and non-OPEC producers discuss the possible reduction in oil production
In this review, we suggest considering the personal composite instrument (PCI) &SumOIL/GAS. It reflects the price dynamics of the portfolio of futures on oil of two brands – Brent and WTI against futures on natural gas. Will SumOIL/GAS prices rise?Such a movement indicates that oil prices rise, while natural gas prices fall. In November, oil production rose to 11.7 million barrels per day and the production of shale gas also increased sharply in the US. In the Permian oil and gas basin located in the state of Texas, an excess of gas has been formed on Waha hub site and its price has fallen by 80% to a historical low since the start of operation of this site in 1991. Market participants do not exclude the reduction of gas prices on other American sites, including Henry Hub in Louisiana. According to U.S. Commodity Futures Trading Commission (CFTC), there was a massive closure of long positions on the purchase of gas on the New York Mercantile Exchange (NYMEX) last week. It turned out to be the 3rd largest closure since 2006. An additional negative factor for US natural gas prices was the warm weather in the United States, which reduces its demand for heating purposes. Meanwhile, the average gas production in the United States for the last 30 days reached a historic high and amounted to 87.2 billion cubic feet per day. The cost of oil is now correcting upwards in anticipation of the possible reduction in OPEC production at the next meeting on December 6, 2018, as well as the reduction in the intensity of the trade war between the US and China amid their meeting at the G20 summit at the end of this week.
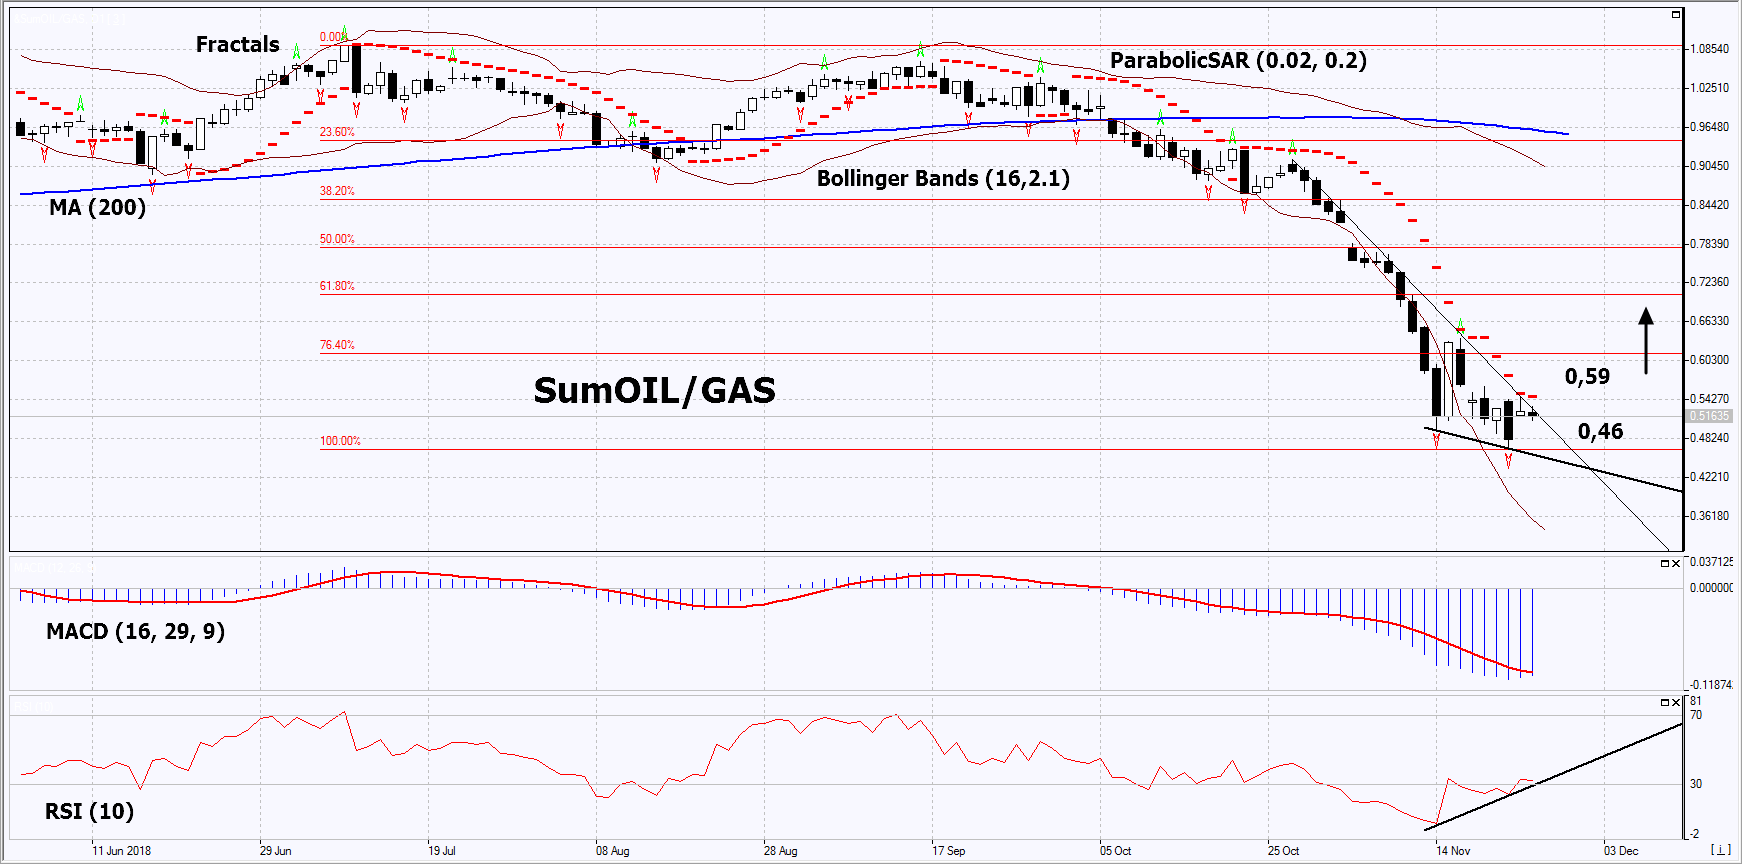
On the daily timeframe, SumOIL/GAS: D1 has updated the low since March 2009 and is trying to correct up within the downtrend. A number of technical analysis indicators formed buy signals. The further price increase is possible in case of a reduction in oil production of OPEC and non-OPEC producers and an excess of natural gas in the US.
- The Parabolic indicator gives a bearish signal. It can be used as an additional resistance level, which must be overcome before opening a buy position.
- The Bollinger bands have widened strongly, which indicates high volatility.
- The RSI indicator is below 50. It has formed a positive divergence.
- The MACD indicator gives a bullish signal.
The bullish momentum may develop in case SumOIL/GAS exceeds the Parabolic signal at 0.59. This level may serve as an entry point. The initial stop loss may be placed below the last fractal low and the low since March 2009 at 0.46. After opening the pending order, we shall move the stop to the next fractal low following the Bollinger and Parabolic signals. Thus, we are changing the potential profit/loss to the breakeven point. More risk-averse traders may switch to the 4-hour chart after the trade and place there a stop loss moving it in the direction of the trade. If the price meets the stop level (0.46) without reaching the order (0.59), we recommend to close the position: the market sustains internal changes that were not taken into account.
Summary of technical analysis
| Position | Buy |
| Buy stop | Above 0.59 |
| Stop loss | Below 0.46 |
- コースを取って、

【重要な注意事項】:
本レポートは、当社の親会社であるアイエフシーマーケットが作成したものの邦訳です。本レポートには、当社のサービスと商品についての情報を含みますが、お客様の投資目的、財務状況、資金力にかかわらず、情報の提供のみを目的とするものであり、金融商品の勧誘、取引の推奨、売買の提案等を意図したものではありません。 本レポートは、アイエフシーマーケットが信頼できると思われる情報にもとづき作成したものですが、次の点に十分ご留意ください。アイエフシーマーケットおよび当社は、本レポートが提供する情報、分析、予測、取引戦略等の正確性、確実性、完全性、安全性等について一切の保証をしません。アイエフシーマーケットおよび当社は、本レポートを参考にした投資行動が利益を生んだり損失を回避したりすることを保証または約束あるいは言外に暗示するものではありません。アイエフシーマーケットおよび当社は、本レポートに含まれる不確実性、不正確性、不完全性、誤謬、文章上の誤り等に起因して、お客様または第三者が損害(直接的か間接的かを問いません。)を被った場合でも、一切の責任を負いません。
