- マーケット分析
- テクニカル分析
玄米 テクニカル分析 - 玄米 取引:2018-12-04
Global rice shortage is expected
The British company Economist Intelligence Unit (EIU) has published another review of the global rice market. Will Rice price continue to rise?
According to forecasts of the EIU, the global rice consumption in the 2018/19 agricultural season will increase by 1.4% to a record level of 500 million tons. In the next 2019/20 season, it will increase by another 1% to 505 million tons. At the same time, the world rice production in 2018/19 season will be only 493 million tons and in 2019/20, it will increase only to 499 million tons. Thus, until 2020, there will be a shortage of rice in the world, which should be covered from world reserves. A winter rice sowing reduction is expected in India because of drought in the current 2018/19 season to 0.733 million hectares from 1.051 million hectares in the 2017/18 season. Another factor, which may contribute to the increase in rice prices is its purchase by Iran from India in exchange for Iranian oil. Let us note that the Philippine state agency National Economic and Development Authority (NEDA) is going to reduce import tariffs with the aim of compensating the possible increase in rice prices. Recently, the Philippines purchased 203 thousand tons of rice from Thailand and Vietnam.
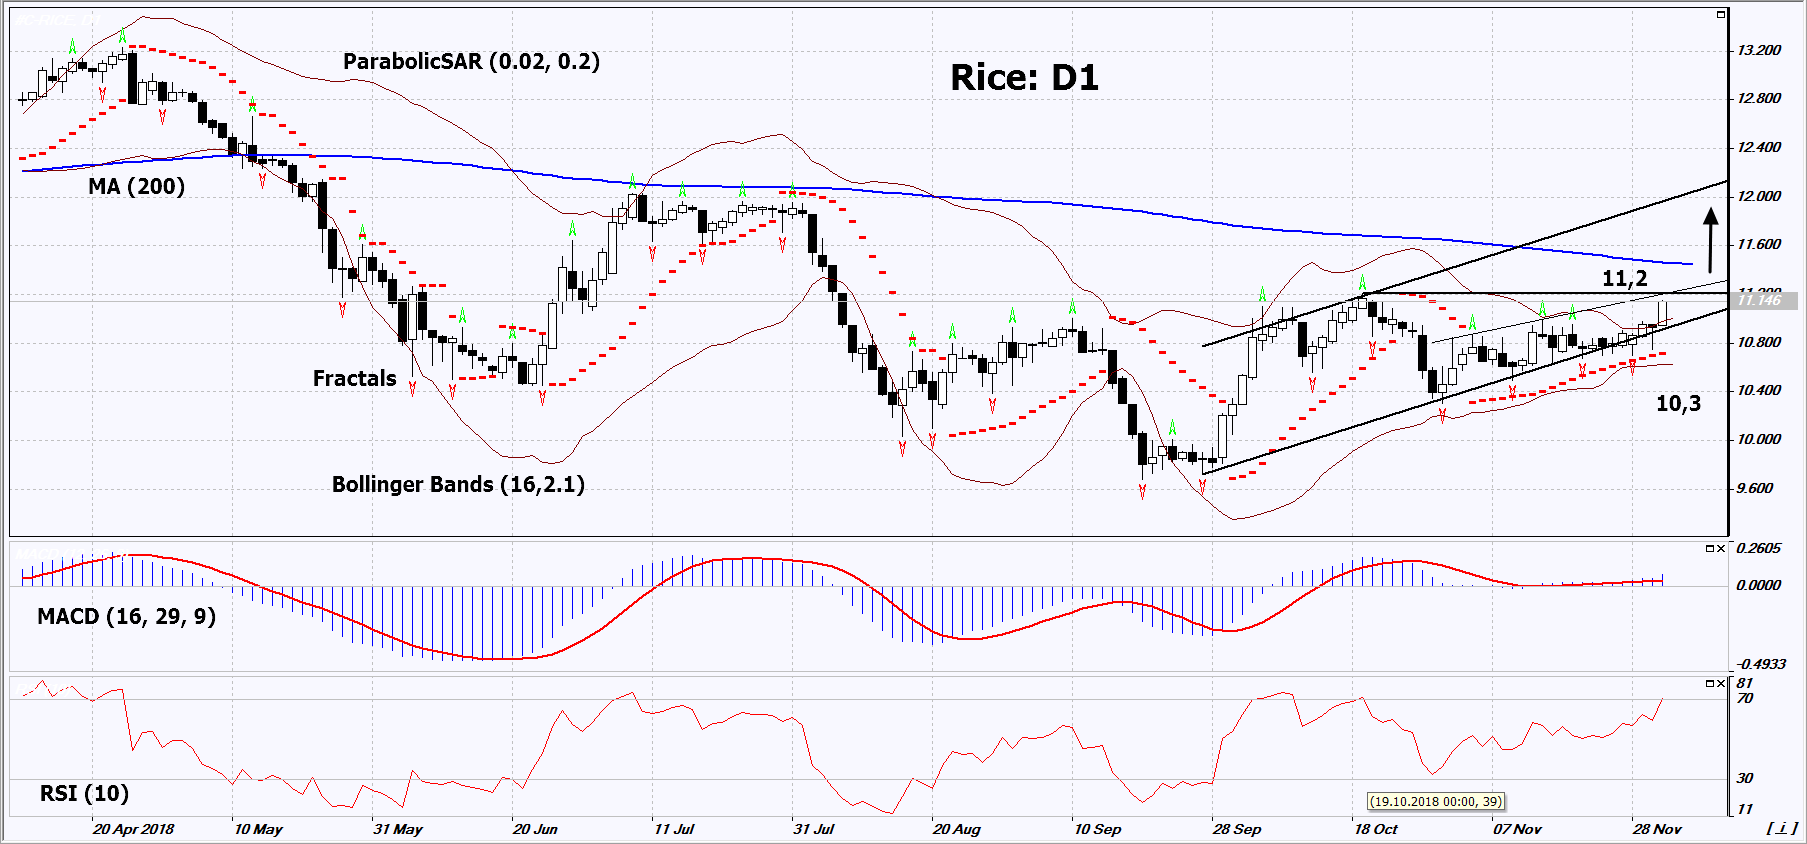
On the daily timeframe, Rice: D1 is rising within the growing channel. A number of technical analysis indicators formed buy signals. The further price increase is possible in case of the deterioration of weather conditions and a reduction in world harvest in the current season.
- The Parabolic indicator gives a bullish signal.
- The Bollinger bands have narrowed strongly, which indicates low volatility. Both bands are titled upwards.
- The RSI indicator is above 50. No divergence.
- The MACD indicator gives a bullish signal.
The bullish momentum may develop in case Rice exceeds its four last fractal highs at 11.2. This level may serve as an entry point. The initial stop loss may be placed below the four last fractal lows, the Parabolic signal and the lower Bollinger band at 10.3. After opening the pending order, we shall move the stop to the next fractal low following the Bollinger and Parabolic signals. Thus, we are changing the potential profit/loss to the breakeven point. More risk-averse traders may switch to the 4-hour chart after the trade and place there a stop loss moving it in the direction of the trade. If the price meets the stop level (10.3) without reaching the order (11.2), we recommend to close the position: the market sustains internal changes that were not taken into account.
Summary of technical analysis
| Position | Buy |
| Buy stop | Above 11.2 |
| Stop loss | Below 10.3 |
- コースを取って、

【重要な注意事項】:
本レポートは、当社の親会社であるアイエフシーマーケットが作成したものの邦訳です。本レポートには、当社のサービスと商品についての情報を含みますが、お客様の投資目的、財務状況、資金力にかかわらず、情報の提供のみを目的とするものであり、金融商品の勧誘、取引の推奨、売買の提案等を意図したものではありません。 本レポートは、アイエフシーマーケットが信頼できると思われる情報にもとづき作成したものですが、次の点に十分ご留意ください。アイエフシーマーケットおよび当社は、本レポートが提供する情報、分析、予測、取引戦略等の正確性、確実性、完全性、安全性等について一切の保証をしません。アイエフシーマーケットおよび当社は、本レポートを参考にした投資行動が利益を生んだり損失を回避したりすることを保証または約束あるいは言外に暗示するものではありません。アイエフシーマーケットおよび当社は、本レポートに含まれる不確実性、不正確性、不完全性、誤謬、文章上の誤り等に起因して、お客様または第三者が損害(直接的か間接的かを問いません。)を被った場合でも、一切の責任を負いません。
