- マーケット分析
- テクニカル分析
ロブスタコーヒー テクニカル分析 - ロブスタコーヒー 取引:2018-12-26
World harvest forecasts may be excessively optimistic
Marex Spectron forecasts a global coffee deficit in the 2017/18 agricultural season in the amount of 1.7 million bags (60 kg). Will Robusta prices rise?
Previously, the US Department of Agriculture (USDA) published a very optimistic forecast for the world coffee harvest in the 2018/19 season. World production, according to the USDA, will be 174.5 million bags (60 kg), and consumption - 163.6 million. The difference will be used for increasing world reserves. Due to these expectations, in 2018, the cost of Robusta coffee fell by 16% to the low since March 2016. Now the dynamics of prices may strongly depend on weather.
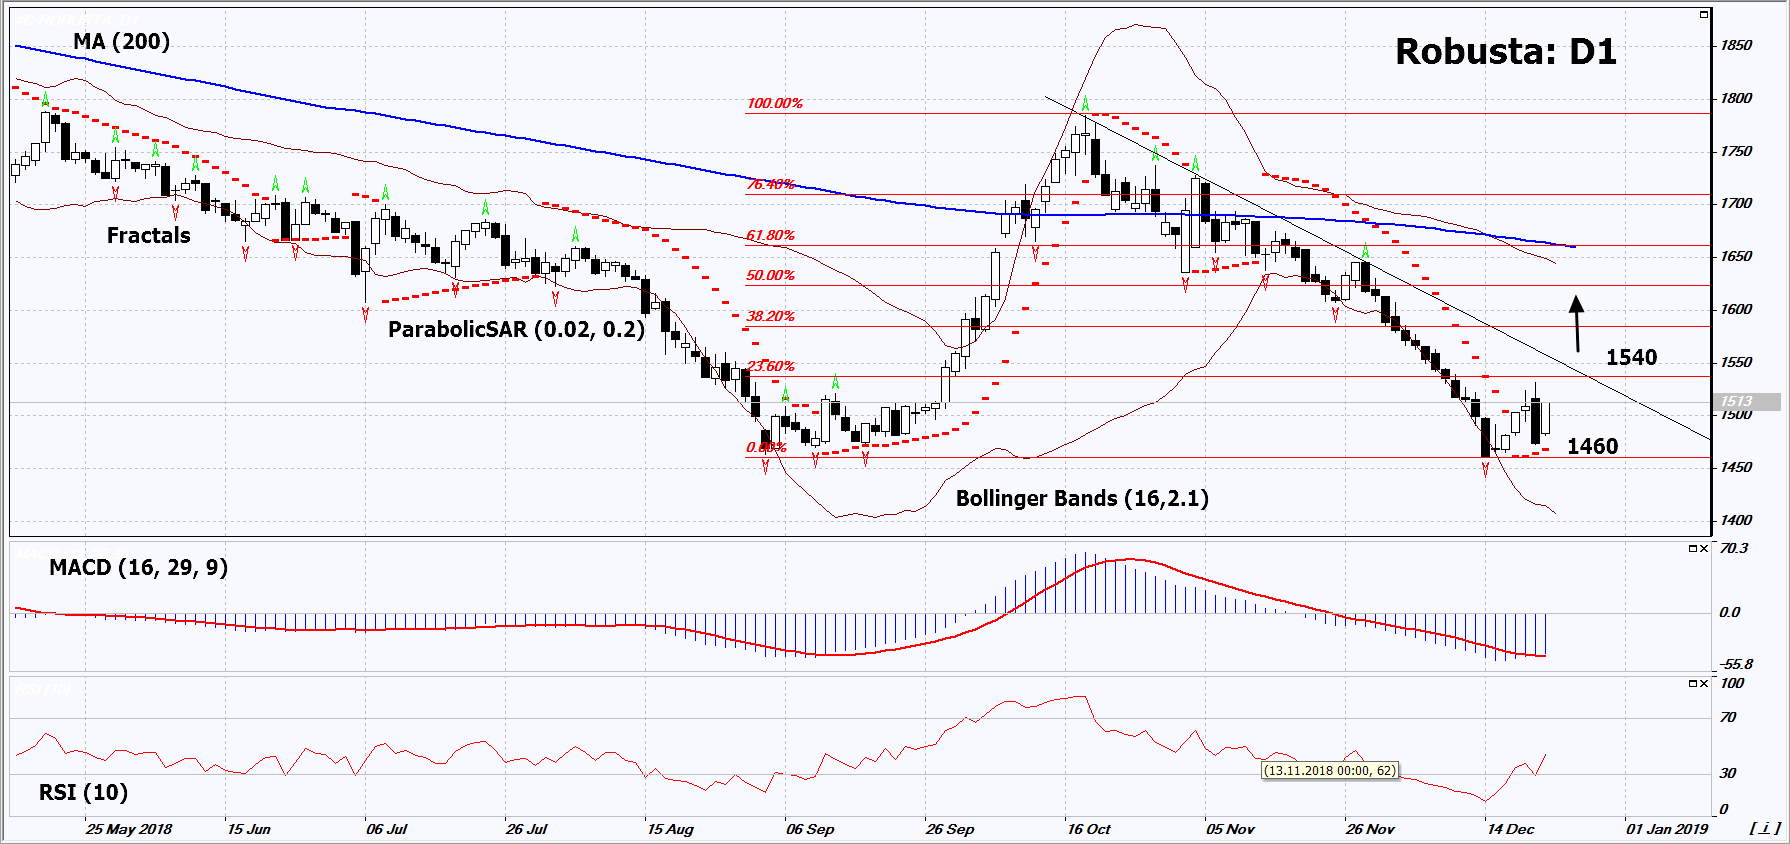
On the daily timeframe, Robusta: D1 remains in a downtrend. It has slowed down and a number of technical analysis indicators have formed buy signals. The further price correction is possible in case of a reduction in world harvest and an increase in demand.
- The Parabolic indicator gives a bullish signal.
- The Bollinger bands are widening strongly, which indicates high volatility.
- The RSI indicator is below 50. No divergence.
- The MACD indicator gives a bullish signal.
The bullish momentum may develop in case Robusta exceeds its last high and the 1st level of Fibonacci at 1540. This level may serve as an entry point. The initial stop loss may be placed below the last fractal low and the Parabolic signal at 1460. After opening the pending order, we shall move the stop to the next fractal low following the Bollinger and Parabolic signals. Thus, we are changing the potential profit/loss to the breakeven point. More risk-averse traders may switch to the 4-hour chart after the trade and place there a stop loss moving it in the direction of the trade. If the price meets the stop level (1460) without reaching the order (1540), we recommend to close the position: the market sustains internal changes that were not taken into account.
Summary of technical analysis
| Position | Buy |
| Buy stop | Above 1540 |
| Stop loss | Below 1460 |
- コースを取って、

【重要な注意事項】:
本レポートは、当社の親会社であるアイエフシーマーケットが作成したものの邦訳です。本レポートには、当社のサービスと商品についての情報を含みますが、お客様の投資目的、財務状況、資金力にかかわらず、情報の提供のみを目的とするものであり、金融商品の勧誘、取引の推奨、売買の提案等を意図したものではありません。 本レポートは、アイエフシーマーケットが信頼できると思われる情報にもとづき作成したものですが、次の点に十分ご留意ください。アイエフシーマーケットおよび当社は、本レポートが提供する情報、分析、予測、取引戦略等の正確性、確実性、完全性、安全性等について一切の保証をしません。アイエフシーマーケットおよび当社は、本レポートを参考にした投資行動が利益を生んだり損失を回避したりすることを保証または約束あるいは言外に暗示するものではありません。アイエフシーマーケットおよび当社は、本レポートに含まれる不確実性、不正確性、不完全性、誤謬、文章上の誤り等に起因して、お客様または第三者が損害(直接的か間接的かを問いません。)を被った場合でも、一切の責任を負いません。
