- マーケット分析
- テクニカル分析
砂糖 テクニカル分析 - 砂糖 取引:2016-05-20
Dry weather expected to boost sugar prices
Sugar prices rose on upward revised estimates of global supply shortage due to lower cane crop in Asia because of El Nino induced drought. At the same time sugar output in Brazil is higher as the cane crushing season began in country’s Centre South region. Will the price of sugar continue rising?
Sugar futures prices have been rising recently on several analyst projections of growing global deficit. On Monday market analyst Platts Kingsman increased by 20% its estimate for the 2016-17 deficit to 7.67m tonnes. On Wednesday an Australian consultancy Green Pool revised upward to 6.5m tonnes from 4.95m tonnes its forecast for the shortfall in world sugar output from demand in 2016-17. The lower output is expected due to lower Asian cane crops because of dry weather caused by El Nino. India is expected to become a net sugar importer of 850000 tonnes next season as El Nino may hinder cane planting, resulting in 2016-17 output drop by 900,000 tonnes to 23.4m tonnes. Global deficit estimates were increased even after world’s top sugar producer Brazil reported the sugar output from Center South region, accounting for 90% of country’s production, was up 71% year on year at 1.81m tonnes. The commitment of traders report released last Friday by the US Commodity Futures trading Commission showed speculators had increased their net long position in the sugar market by 19550 contracts to 193340 contracts the previous week. The new report will be released today, and a further build in net longs will confirm managed money is positioning for a further rise in sugar prices.
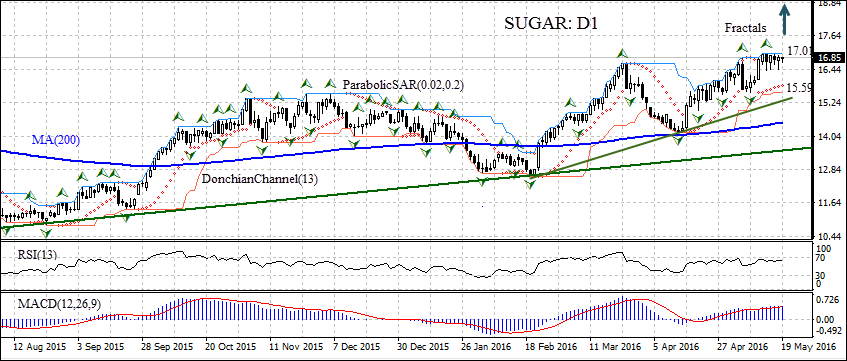
On the daily timeframe SUGAR: D1 has been rising since August last year. In the recent rally which started in mid-April the price bounced off the 200-day moving average MA(200) and rose by over 19% from the low of 14.21 cents per pound. It is currently consolidating after hitting a 21-month high last Friday. The Parabolic indicator has formed a buy signal. The Donchian channel is tilted upward, indicating an uptrend. The RSI oscillator is edging toward the overbought zone but hasn’t crossed it yet. The MACD indicator is above the signal line and the zero level, which is also a bullish signal. We believe the uptrend will continue after the price closes above the last fractal high and the upper boundary of the Donchian channel at 17.01. It can be used as an entry point for setting a pending buy order. The stop loss can be placed below last fractal low at 15.59, which is confirmed also by the lower Donchian channel. After placing the order, the stop loss is to be moved to the next fractal low following Parabolic signals. If the price meets the stop loss level at 15.59 without reaching the order at 17.01, we recommend cancelling the position: the market sustains internal changes which were not taken into account.
| Position | Buy |
| Buy stop | above 17.01 |
| Stop loss | below 15.59 |
- コースを取って、

【重要な注意事項】:
本レポートは、当社の親会社であるアイエフシーマーケットが作成したものの邦訳です。本レポートには、当社のサービスと商品についての情報を含みますが、お客様の投資目的、財務状況、資金力にかかわらず、情報の提供のみを目的とするものであり、金融商品の勧誘、取引の推奨、売買の提案等を意図したものではありません。 本レポートは、アイエフシーマーケットが信頼できると思われる情報にもとづき作成したものですが、次の点に十分ご留意ください。アイエフシーマーケットおよび当社は、本レポートが提供する情報、分析、予測、取引戦略等の正確性、確実性、完全性、安全性等について一切の保証をしません。アイエフシーマーケットおよび当社は、本レポートを参考にした投資行動が利益を生んだり損失を回避したりすることを保証または約束あるいは言外に暗示するものではありません。アイエフシーマーケットおよび当社は、本レポートに含まれる不確実性、不正確性、不完全性、誤謬、文章上の誤り等に起因して、お客様または第三者が損害(直接的か間接的かを問いません。)を被った場合でも、一切の責任を負いません。
