- マーケット分析
- テクニカル分析
USD/CAD テクニカル分析 - USD/CAD 取引:2016-05-17
Canada wildfire may weaken national currency
Canadian dollar fell in mid-January 2016 to the lowest in 11-years against the US dollar. On the USDCAD chart it looks as growth. After that it started to strengthen together with global oil prices. In the beginning of May the trend reversed amid sharp decline in oil production in Canada due to wildfires and weak economic data from China which is the main importer of Canadian oil. Will the Canadian dollar continue weakening?
Wild fires in Canada spread to 241 thousand hectares and caused around 1mln barrels a day oil production cuts. As a result, Canada’s GDP outlook in Q2 2016 may be revised down. The data for Q1 are due on May 31. This weekend the industrial production data came out for April – the indicator rose only 6% instead of the expected 6.5% growth. At the same time the China’s retail sales for April came out with 10.1% increase year on year which is below their expected rise of 10.5%. The Chinese economic slowdown may take its tall on Canadian exports. This week the most significant economic data will come out on Friday: the retail sales for March and inflation for April. We see their tentative outlook as negative.
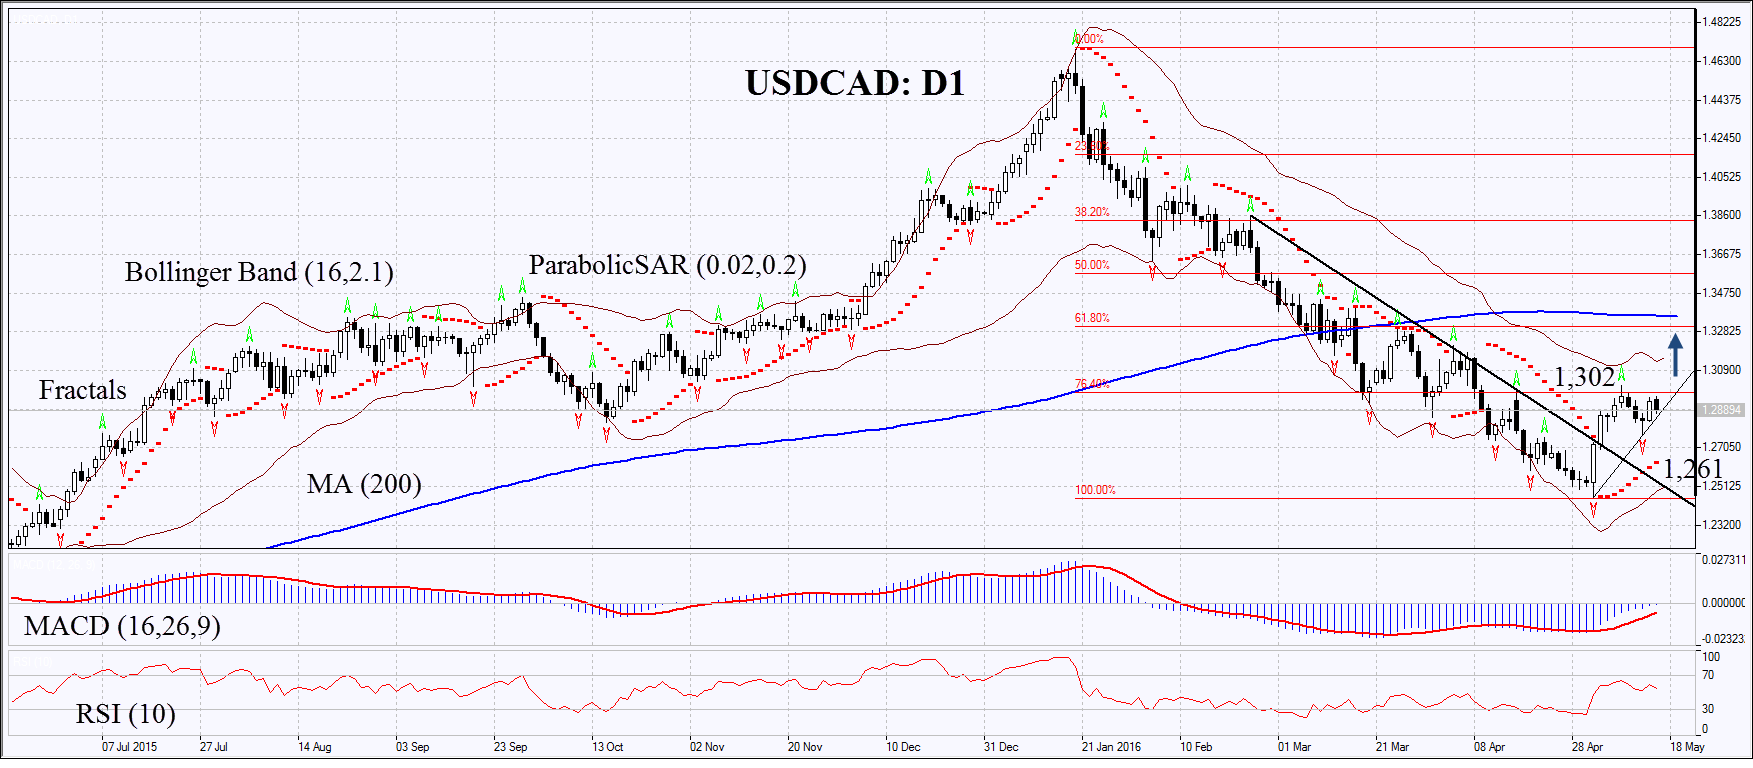
On the daily chart USDCAD: D1 has left the downtrend to correct upwards. It has reached the 1st Fibonacci retracement but failed to surpass it. The MACD and Parabolic give signals to buy. RSI is above 50, no divergence. The Bollinger bands have contracted which means lower volatility. They are tilted upwards. The bullish momentum may develop in case the Canadian dollar surpasses the last fractal high and the 1st Fibonacci retracement at 1.302. This level may serve the point of entry. The initial risk-limit may be placed below the Parabolic signal and the last fractal low at 1.261. Having opened the pending order we shall move the stop to the next fractal low following the Parabolic and Bollinger signals. Thus, we are changing the probable profit/loss ratio to the breakeven point. The most risk-averse traders may switch to the 4-hour chart after the trade and place there a stop-loss moving it in the direction of the trade. If the price meets the stop-loss level at 1.261 without reaching the order at 1.302, we recommend cancelling the position: the market sustains internal changes which were not taken into account.
| Position | Buy |
| Buy stop | above 1.302 |
| Stop loss | below 1.261 |
- コースを取って、

【重要な注意事項】:
本レポートは、当社の親会社であるアイエフシーマーケットが作成したものの邦訳です。本レポートには、当社のサービスと商品についての情報を含みますが、お客様の投資目的、財務状況、資金力にかかわらず、情報の提供のみを目的とするものであり、金融商品の勧誘、取引の推奨、売買の提案等を意図したものではありません。 本レポートは、アイエフシーマーケットが信頼できると思われる情報にもとづき作成したものですが、次の点に十分ご留意ください。アイエフシーマーケットおよび当社は、本レポートが提供する情報、分析、予測、取引戦略等の正確性、確実性、完全性、安全性等について一切の保証をしません。アイエフシーマーケットおよび当社は、本レポートを参考にした投資行動が利益を生んだり損失を回避したりすることを保証または約束あるいは言外に暗示するものではありません。アイエフシーマーケットおよび当社は、本レポートに含まれる不確実性、不正確性、不完全性、誤謬、文章上の誤り等に起因して、お客様または第三者が損害(直接的か間接的かを問いません。)を被った場合でも、一切の責任を負いません。
