- マーケット分析
- テクニカル分析
USD/CAD テクニカル分析 - USD/CAD 取引:2017-12-27
Preparing for the Bank of Canada meeting
World oil prices continue to rise. Will the Canadian dollar quotes strengthen? On the USDCAD chart, this looks like a decline.
Hydrocarbons account for about a quarter of the Canadian exports. Their price growth improves the performance of the Canadian economy and contributes to the strengthening of the national currency. Brent oil price reached $66 per barrel after a report on the explosion of the pipeline in Libya, which supplies the oil terminal Es Sider. Since early 2017, Brent prices have grown by 17%. The Canadian dollar rose by 5.6% against the US dollar for the same period. An additional positive factor for the Canadian dollar may be an increase in the Bank of Canada rate at its regular meeting on January 17, 2018. Inflation for November reached 2.1% in annual terms, while its target level is 2% plus/minus 1%. The same inflation level was observed in January 2017, after which the Bank of Canada hiked the rates twice in July and September. Its current rate is 1%. It is below the US Fed’s rate range of 1.25-1.5%. Significant economic data in Canada will be published from January 2, 2018 when the Manufacturing PMI for December is released. Till the Bank of Canada meeting, there will be quite a lot of data, which may affect the rate decision. Currently the probability of its growth is estimated at about 60%.
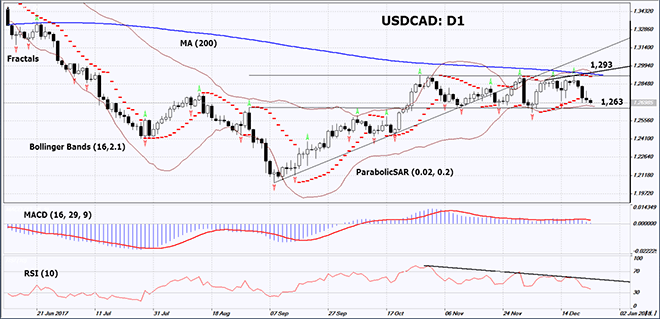
On the daily timeframe, USDCAD: D1 switched from the rising to neutral trend. A downward correction is possible in case of the Bank of Canada rate hike.
- The Parabolic indicator gives a bearish signal.
- The Bollinger bands have narrowed, which means lower volatility. They are tilted down.
- The RSI indicator is below 50. It has formed a negative divergence.
- The MACD indicator gives a bearish signal.
The bearish momentum may develop in case USDCAD drops below the two last fractal lows, the lower Bollinger band and the support line of the neutral range at 1.263. This level may serve as an entry point. The initial stop loss may be placed above the last fractal high, the upper Bollinger band, the 200-day moving average line, the resistance line of the neutral range and the Parabolic signal at 1.293. After opening the pending order, we shall move the stop to the next fractal high following the Bollinger and Parabolic signals. Thus, we are changing the potential profit/loss to the breakeven point. More risk-averse traders may switch to the 4-hour chart after the trade and place there a stop loss moving it in the direction of the trade. If the price meets the stop level at 1.293 without reaching the order at 1.263, we recommend cancelling the position: the market sustains internal changes that were not taken into account.
Summary of technical analysis
| Position | Sell |
| Sell stop | below 1,263 |
| Stop loss | above 1,293 |
- コースを取って、

【重要な注意事項】:
本レポートは、当社の親会社であるアイエフシーマーケットが作成したものの邦訳です。本レポートには、当社のサービスと商品についての情報を含みますが、お客様の投資目的、財務状況、資金力にかかわらず、情報の提供のみを目的とするものであり、金融商品の勧誘、取引の推奨、売買の提案等を意図したものではありません。 本レポートは、アイエフシーマーケットが信頼できると思われる情報にもとづき作成したものですが、次の点に十分ご留意ください。アイエフシーマーケットおよび当社は、本レポートが提供する情報、分析、予測、取引戦略等の正確性、確実性、完全性、安全性等について一切の保証をしません。アイエフシーマーケットおよび当社は、本レポートを参考にした投資行動が利益を生んだり損失を回避したりすることを保証または約束あるいは言外に暗示するものではありません。アイエフシーマーケットおよび当社は、本レポートに含まれる不確実性、不正確性、不完全性、誤謬、文章上の誤り等に起因して、お客様または第三者が損害(直接的か間接的かを問いません。)を被った場合でも、一切の責任を負いません。
