- マーケット分析
- テクニカル分析
USD/JPY テクニカル分析 - USD/JPY 取引:2016-12-27
Significant economic data will come out in Japan
On Tuesday early in the morning the inflation data and household spending for November will come out in Japan. We believe they may make yen a bit stronger. Will USDJPY chart fall?
Due to preliminary forecasts, household spending rose in Japan in November for the first time since this February. This may revive the economy. Moreover, despite the expected same pace of core deflation year over year, it may fall in November to -0.3% from -0.4% in October 2016. The Bank of Japan aims at fighting deflation and reaching 2% inflation. Weak consumer confidence for December is expected to come out in US on Tuesday which may support the yen rate against the US dollar. Manufacturing production for November will come out in Japan on Wednesday. According to forecasts, they may be positive for the yen. Next significant data will come only on January 4, 2017.
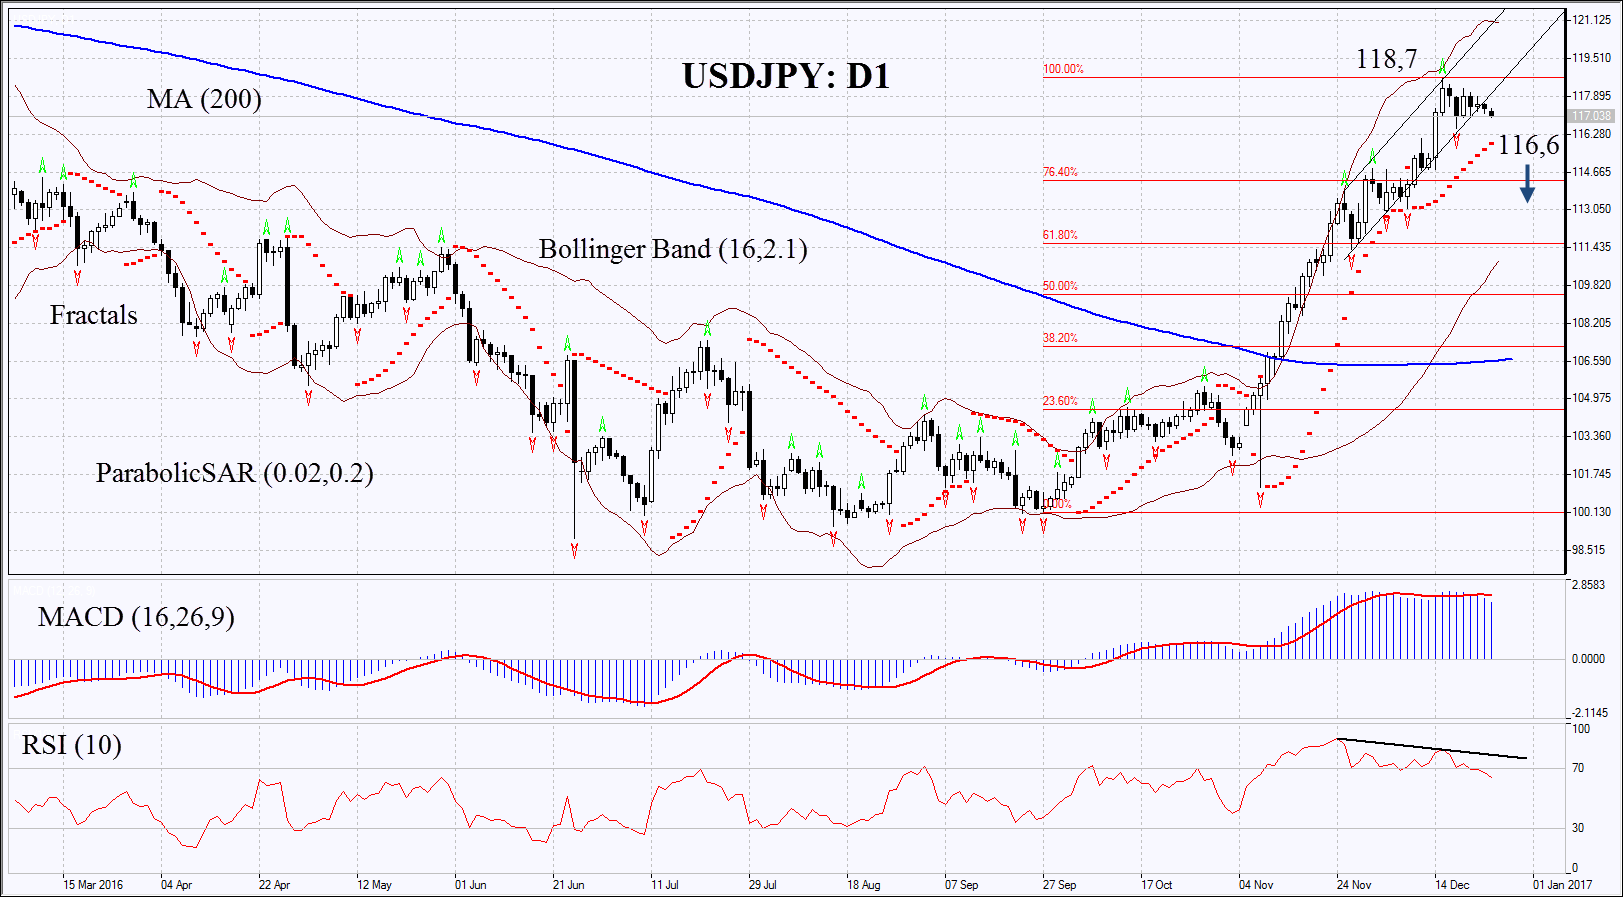
On the daily chart USDJPY: D1 is trending upwards. It hit a 11-month high two weeks ago. Now the pace of growth has slowed down and several technical indicators point at the chance of downward correction. Further strengthening of yen is possible in case of positive economic data in Japan and negative in US.
- Parabolic gives bullish signals which may serve an additional level of support. In such a case the price shall fall below the support to open a position.
- Bollinger bands have widened which means higher volatility.
- RSI has left the overbought zone having formed negative divergence.
- MACD gives bearish signals.
The bearish momentum may develop in case USDJPY falls below the last fractal low at 116.6. This level may serve the point of entry. The initial stop-loss may be placed above the 11-month high at 118.7. Having opened the pending order we shall move the stop to the next fractal high following the Parabolic and Bollinger signals. Thus, we are changing the probable profit/loss ratio to the breakeven point. The most risk-averse traders may switch to the 4-hour chart after the trade and place there a stop-loss moving it in the direction of the trade. If the price meets the stop-loss level at 118.7 without reaching the order at 116.6, we recommend cancelling the position: the market sustains internal changes which were not taken into account.
Summary of technical analysis
| Position | Sell |
| Sell stop | below 116.6 |
| Stop loss | above 118.7 |
- コースを取って、

【重要な注意事項】:
本レポートは、当社の親会社であるアイエフシーマーケットが作成したものの邦訳です。本レポートには、当社のサービスと商品についての情報を含みますが、お客様の投資目的、財務状況、資金力にかかわらず、情報の提供のみを目的とするものであり、金融商品の勧誘、取引の推奨、売買の提案等を意図したものではありません。 本レポートは、アイエフシーマーケットが信頼できると思われる情報にもとづき作成したものですが、次の点に十分ご留意ください。アイエフシーマーケットおよび当社は、本レポートが提供する情報、分析、予測、取引戦略等の正確性、確実性、完全性、安全性等について一切の保証をしません。アイエフシーマーケットおよび当社は、本レポートを参考にした投資行動が利益を生んだり損失を回避したりすることを保証または約束あるいは言外に暗示するものではありません。アイエフシーマーケットおよび当社は、本レポートに含まれる不確実性、不正確性、不完全性、誤謬、文章上の誤り等に起因して、お客様または第三者が損害(直接的か間接的かを問いません。)を被った場合でも、一切の責任を負いません。
