- マーケット分析
- テクニカル分析
USD/JPY テクニカル分析 - USD/JPY 取引:2019-04-15
Sales tax may be increased in Japan
The Japanese government is going to increase the sales tax to 10% from 8%. Will the quotations for USDJPY increase?
Such a move indicates the weakening of yen against the US dollar. Sales tax is applied in Japan instead of VAT. Its previous increase from 5% to 8% was implemented on April 1, 2014, but was announced about six months before. In 2014, the increase in sales tax contributed to the weakening of the exchange rate from 100 to 125 yen per US dollar. In 2019 the sales tax can be raised from October 1. An additional negative factor for the yen may be the statement by the Minister of Finance of Japan Taro Aso about the increased risks of a slowdown in the global economy, which he made at a meeting of finance ministers and heads of central banks of the G20 countries. He also noted that even the level of sales tax of 10% is still low compared to world standards. Important macroeconomic data will be released in Japan on April 17 and 19: the trade balance and inflation for March. It can affect the dynamics of the yen.
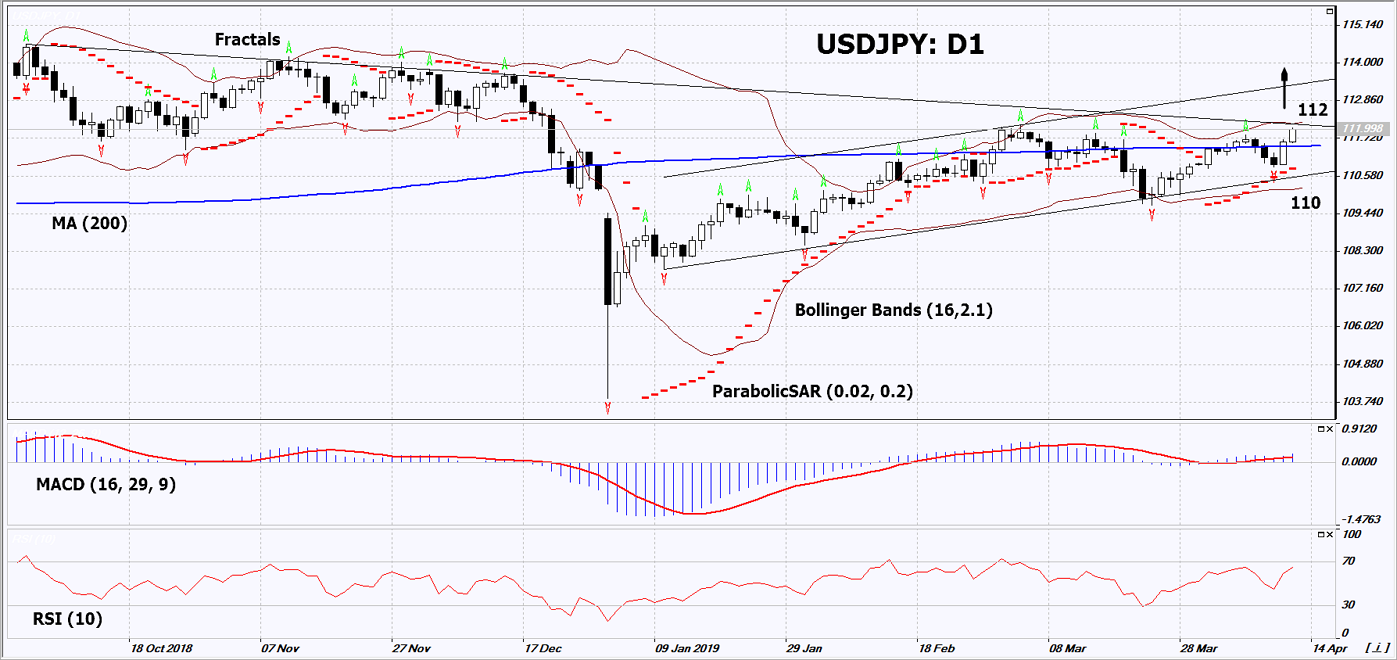
On the daily timeframe, USDJPY: D1 is in a growing trend. Various technical analysis indicators have formed an uptrend. Further growth of quotations is possible in case of publication of negative macroeconomic data in Japan.
- The Parabolic indicator has formed a buy signal.
- The Bollinger Bands narrowed, indicating a decrease in volatility. Both lines of Bollinger have a slope up
- The RSI indicator is above 50. No divergence has been formed.
- The MACD indicator gives a bullish signal.
The bullish momentum may develop in case if USDJPY exceeds the upper Bollinger band and 4 last upper fractals: 112,21. This level may serve as an entry point. The initial stop loss may be placed below 200-day moving average line, Parabolic signal and the lower Bollinger line: 110. After opening a pending order, we shall move the stop to the next fractal low following the Bollinger and Parabolic signals. Thus, we are changing the potential profit/loss to the breakeven point. More risk-averse traders may switch to the 4-hour chart after the trade and place there a stop loss moving it in the direction of the trade. If the price meets the stop level (110), without reaching the order (112,21), we recommend to delete the order: the market sustains internal changes that were not taken into account.
Technical Analysis Summary
| Position | Buy |
| Buy stop | Above 112,21 |
| Stop loss | Below 110 |
- コースを取って、

【重要な注意事項】:
本レポートは、当社の親会社であるアイエフシーマーケットが作成したものの邦訳です。本レポートには、当社のサービスと商品についての情報を含みますが、お客様の投資目的、財務状況、資金力にかかわらず、情報の提供のみを目的とするものであり、金融商品の勧誘、取引の推奨、売買の提案等を意図したものではありません。 本レポートは、アイエフシーマーケットが信頼できると思われる情報にもとづき作成したものですが、次の点に十分ご留意ください。アイエフシーマーケットおよび当社は、本レポートが提供する情報、分析、予測、取引戦略等の正確性、確実性、完全性、安全性等について一切の保証をしません。アイエフシーマーケットおよび当社は、本レポートを参考にした投資行動が利益を生んだり損失を回避したりすることを保証または約束あるいは言外に暗示するものではありません。アイエフシーマーケットおよび当社は、本レポートに含まれる不確実性、不正確性、不完全性、誤謬、文章上の誤り等に起因して、お客様または第三者が損害(直接的か間接的かを問いません。)を被った場合でも、一切の責任を負いません。
