- マーケット分析
- テクニカル分析
USD/NOK テクニカル分析 - USD/NOK 取引:2018-12-11
Preparing for the meeting of the Central Bank of Norway
The next meeting of Norges Bank will be held on December 13. Is there a possibility for the Norwegian krone to strengthen?
On the USDNOK chart, it looks like a downward movement. Now, the Norges Bank’s rate is + 0.75%. Inflation in Norway in November 2018 increased to 3.5%, which is a 2-year high. Thus, consumer price growth has significantly exceeded the target level of the Norwegian Central Bank, which is 2.5%. In June 2018, the regulator has already raised the rate. Now, it is difficult to say whether he will do that once again this year. Various statements by Norges Bank’s representatives my affect the exchange rate of the krone. In addition to the possible rate hikes, an additional positive factor for the krone is the forecast of Statistics Norway (SSB). It increased the growth of non-oil GDP for the next year to 2.7% from 2.4% and expects inflation to accelerate. According to the SSB, the Norwegian Central Bank will increase its rate 5 times until the end of 2021. The business community Confederation of Norwegian Enterprise (NHO) has also raised its forecast for the growth of the Norwegian economy in 2019-2021. The GDP data for October, which may also affect the USDNOK dynamics, will be published on December 11 in Norway. Let us note that this currency may be sensitive to oil price changes, as Norway is an oil-producing country.
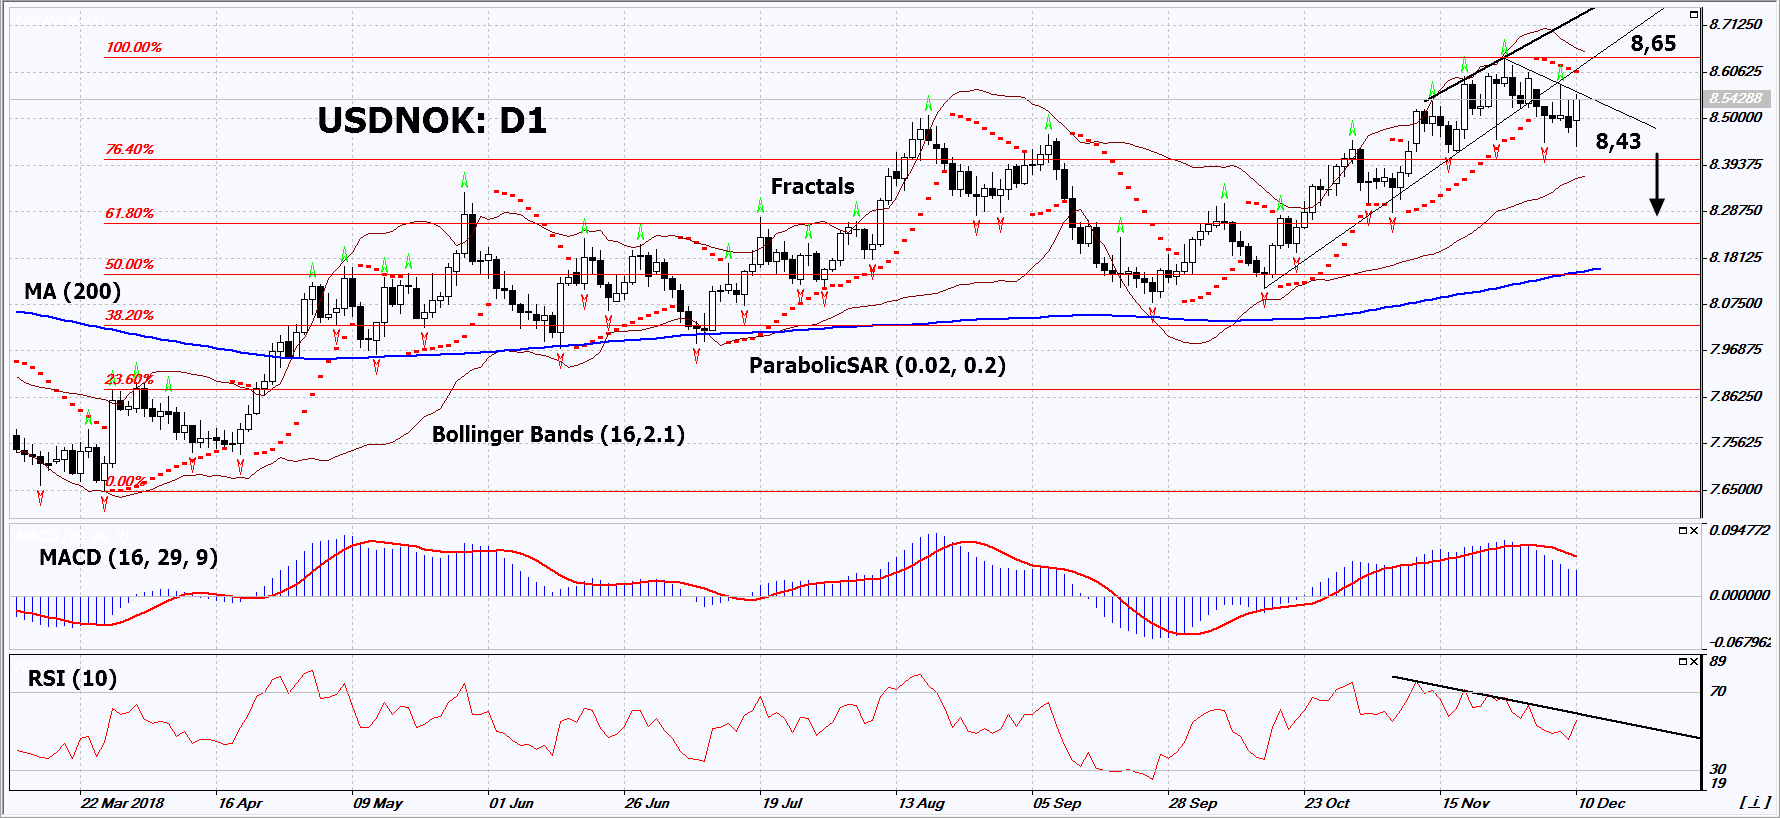
On the daily timeframe, USDNOK: D1 approached the support line of the uptrend. It must be breached down before opening a sell position. The further price increase is possible in case of the publication of positive macroeconomic data in Switzerland.
- The Parabolic indicator gives a bearish signal.
- The Bollinger bands are narrowing, which indicates low volatility. The upper band is titled downward.
- The RSI indicator is above 50. It has formed a negative divergence.
- The MACD indicator gives a bearish signal.
The bearish momentum may develop in case USDNOK falls below its last low at 8.43. This level may serve as an entry point. The initial stop loss may be placed above the last fractal high, the high since May 2017, the upper Bollinger band and the Parabolic signal at 865. After opening the pending order, we shall move the stop to the next fractal high following the Bollinger and Parabolic signals. Thus, we are changing the potential profit/loss to the breakeven point. More risk-averse traders may switch to the 4-hour chart after the trade and place there a stop loss moving it in the direction of the trade. If the price meets the stop level (8.65) without reaching the order (8.43), we recommend to close the position: the market sustains internal changes that were not taken into account.
Summary of technical analysis
| Position | Sell |
| Sell stop | Below 8.43 |
| Stop loss | Above 8.65 |
- コースを取って、

【重要な注意事項】:
本レポートは、当社の親会社であるアイエフシーマーケットが作成したものの邦訳です。本レポートには、当社のサービスと商品についての情報を含みますが、お客様の投資目的、財務状況、資金力にかかわらず、情報の提供のみを目的とするものであり、金融商品の勧誘、取引の推奨、売買の提案等を意図したものではありません。 本レポートは、アイエフシーマーケットが信頼できると思われる情報にもとづき作成したものですが、次の点に十分ご留意ください。アイエフシーマーケットおよび当社は、本レポートが提供する情報、分析、予測、取引戦略等の正確性、確実性、完全性、安全性等について一切の保証をしません。アイエフシーマーケットおよび当社は、本レポートを参考にした投資行動が利益を生んだり損失を回避したりすることを保証または約束あるいは言外に暗示するものではありません。アイエフシーマーケットおよび当社は、本レポートに含まれる不確実性、不正確性、不完全性、誤謬、文章上の誤り等に起因して、お客様または第三者が損害(直接的か間接的かを問いません。)を被った場合でも、一切の責任を負いません。
