- マーケット分析
- テクニカル分析
USD/TRY テクニカル分析 - USD/TRY 取引:2018-11-12
Preparing for the publication of important statistics
Inflation in Turkey in October 2018 increased and updated the high for the last 15 years. Will the USDTRY increase?
Such a movement indicates the weakening of the Turkish lira against the US dollar. In October, inflation in Turkey reached 25.24% year over year. It exceeded the rate of the Turkish Central Bank, which is 24%. An important factor for the exchange rate of the lira may be the data on the current account balance for September, which will be released on November 12, 2018, on Monday. A good surplus of $2 billion is expected. Of course, this is less than the surplus for August in the amount of $ 2.59 billion. However, a positive factor is that in August it was the first time in the last 3 years, and before that, the current account balance of Turkey was in a stable deficit. If there is a noticeable surplus in September, then, this may become the beginning of a positive trend. In case of negative data, the weakening of the lire can accelerate.
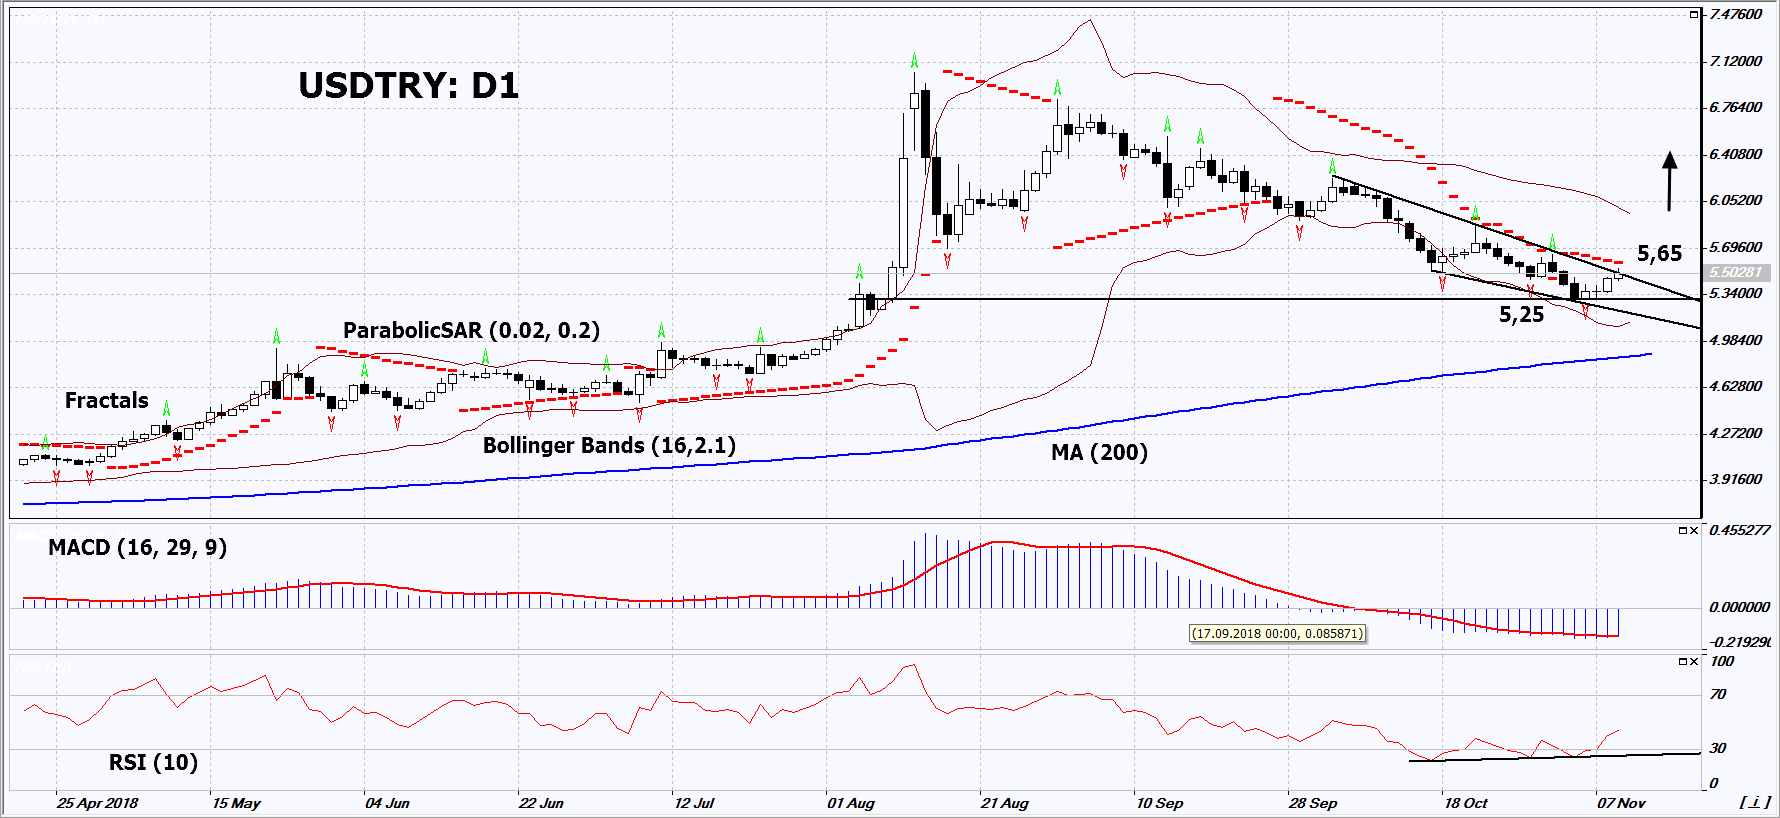
On the daily timeframe, USDTRY: D1 approached the resistance line of the downtrend and is correcting upwards from the 3-month low. The further price increase is possible in case of the publication of negative economic data in Turkey.
- The Parabolic indicator gives a bearish signal. It can be used as an additional resistance level, which must be overcome before opening a buy position.
- The Bollinger bands are narrowing, which indicates low volatility. The upper band is titled upwards.
- The RSI indicator is below 50. It has formed a positive divergence.
- The MACD indicator gives a bullish signal.
The bullish momentum may develop in case USDTRY exceeds the last fractal high and the Parabolic signal at 5.65. This level may serve as an entry point. The initial stop loss may be placed below the last fractal low and the 3-month low at 5.25. After opening the pending order, we shall move the stop to the next fractal low following the Bollinger and Parabolic signals. Thus, we are changing the potential profit/loss to the breakeven point. More risk-averse traders may switch to the 4-hour chart after the trade and place there a stop loss moving it in the direction of the trade. If the price meets the stop level (5.25) without reaching the order (5.65), we recommend cancelling the position: the market sustains internal changes that were not taken into account.
Summary of technical analysis
| Position | Buy |
| Buy stop | Above 5,65 |
| Stop loss | Below 5,25 |
- コースを取って、

【重要な注意事項】:
本レポートは、当社の親会社であるアイエフシーマーケットが作成したものの邦訳です。本レポートには、当社のサービスと商品についての情報を含みますが、お客様の投資目的、財務状況、資金力にかかわらず、情報の提供のみを目的とするものであり、金融商品の勧誘、取引の推奨、売買の提案等を意図したものではありません。 本レポートは、アイエフシーマーケットが信頼できると思われる情報にもとづき作成したものですが、次の点に十分ご留意ください。アイエフシーマーケットおよび当社は、本レポートが提供する情報、分析、予測、取引戦略等の正確性、確実性、完全性、安全性等について一切の保証をしません。アイエフシーマーケットおよび当社は、本レポートを参考にした投資行動が利益を生んだり損失を回避したりすることを保証または約束あるいは言外に暗示するものではありません。アイエフシーマーケットおよび当社は、本レポートに含まれる不確実性、不正確性、不完全性、誤謬、文章上の誤り等に起因して、お客様または第三者が損害(直接的か間接的かを問いません。)を被った場合でも、一切の責任を負いません。
