- マーケット分析
- テクニカル分析
ルーブルに対する小麦 テクニカル分析 - ルーブルに対する小麦 取引:2019-05-15
Sowing wheat in the US is behind schedule
In this review we suggest to consider the WHEAT / RUB Personal Composite Instrument(PCI). It reflects the price dynamics of wheat versus Russian ruble. Is the growth of WHEAT/RUB quotations possible?
It rises when wheat becomes more expensive on the world market and the Russian currency weakens. The fall of the ruble exchange rate may cause an increase in purchases of foreign currency by the Ministry of Finance of the Russian Federation. In accordance with the “fiscal rule”, the Ministry of Finance of Russian acquires currency for budget revenues from the sale price of Russian oil over $ 40 per barrel. From May 14, 2019 to June 6, ministry will purchase US dollars amounted 16.7 billion rubles ($ 256 million) per day. This is noticeably more than the volume in the previous period, which amounted to 11.6 billion rubles per day. An additional negative factor for the ruble may be the Russian Central Bank's plans to lower the key rate. It is equal to 7.75% with inflation of 5.2%. In turn, wheat has risen in price due to a report that the sowing company is lagging behind the schedule in the Midwestern United States. Russia is going to reduce wheat exports in the agricultural season 2019/20 to 36 million tons, compared with 37 million tons in the 2018/19 season. The Food and Agriculture Organization of the United Nations (FAO) expects a reduction in the grain harvest in Ukraine by 5.6% to 65.3 million tons in 2019.
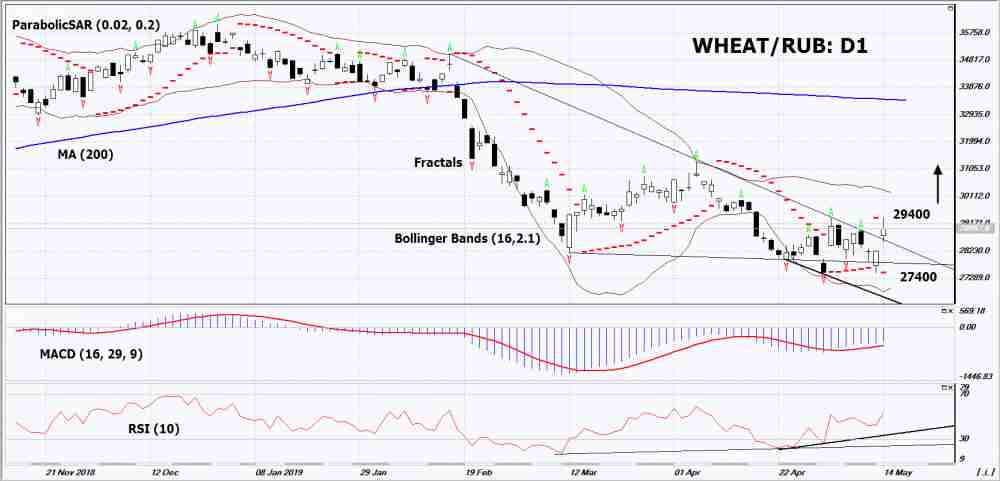
On the daily timeframe, WHEAT/RUB: D1 exceeded the resistance line of the downward trend. Various technical analysis indicators generated uptrend signal. Further growth of quotations is possible in case of an increase in demand and a reduction in world yield.
- The Parabolic indicator demonstrates the signal to increase.
- The Bollinger bands widened, indicating high volatility. The bottom line of Bollinger has a slope up.
- The RSI indicator is above the 50 mark. It formed a double divergence to the rise.
- The MACD indicator indicates a signal to increase.
The bullish momentum may develop if WHEAT/RUB exceeds the last two upper fractals and the Parabolic signal: 29400. This level may serve as an entry point.The initial stop loss may be placed below the last lower fractal and the 11-month minimum: 27400. After opening the pending order, we shall move the stop to the next fractal low following the Bollinger and Parabolic signals to the next fractal minimum. Thus, we are changing the potential profit/loss to the breakeven point. More risk-averse traders may switch to the 4-hour chart after the trade and place there a stop loss moving it in the direction of the trade. If the price meets the stop level (371) without reaching the order (390), we recommend to close the position: the market sustains internal changes that were not taken into account.
Summary of technical analysis
| Position | Buy |
| Buy stop | Above 29400 |
| Stop loss | Below 27400 |
- コースを取って、

【重要な注意事項】:
本レポートは、当社の親会社であるアイエフシーマーケットが作成したものの邦訳です。本レポートには、当社のサービスと商品についての情報を含みますが、お客様の投資目的、財務状況、資金力にかかわらず、情報の提供のみを目的とするものであり、金融商品の勧誘、取引の推奨、売買の提案等を意図したものではありません。 本レポートは、アイエフシーマーケットが信頼できると思われる情報にもとづき作成したものですが、次の点に十分ご留意ください。アイエフシーマーケットおよび当社は、本レポートが提供する情報、分析、予測、取引戦略等の正確性、確実性、完全性、安全性等について一切の保証をしません。アイエフシーマーケットおよび当社は、本レポートを参考にした投資行動が利益を生んだり損失を回避したりすることを保証または約束あるいは言外に暗示するものではありません。アイエフシーマーケットおよび当社は、本レポートに含まれる不確実性、不正確性、不完全性、誤謬、文章上の誤り等に起因して、お客様または第三者が損害(直接的か間接的かを問いません。)を被った場合でも、一切の責任を負いません。
