- マーケット分析
- テクニカル分析
小麦 テクニカル分析 - 小麦 取引:2019-07-12
Lower world wheat ending stock estimate bullish for wheat
Wheat ending stock estimate was lowered in WASDE July report. Will the wheat prices continue rebounding?
Wheat prices are under pressure as harvest gets closer for spring wheat. The US Department of Agriculture revised downward world wheat ending stocks for 2019/20 from previous estimate of 292.43 million metric tons (MMT) to 286.46 MMT in this month’s World Agricultural Supply and Demand Estimates (WASDE) report. Lower wheat ending stock estimate is bullish for wheat. However, USDA upgraded its US all-wheat production estimates from 1.903 billion bushels in June to 1.921 billion bushels due to an increase in winter wheat attributed to better yields. Higher US wheat production is a downside risk for wheat.
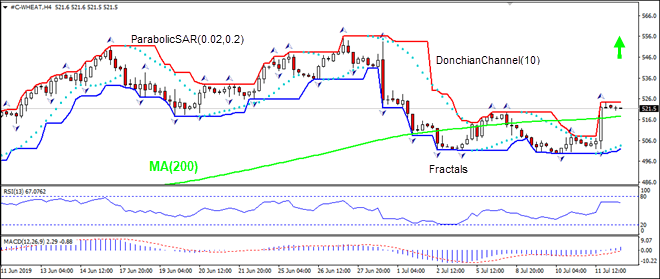
On the 4-hour timeframe the WEHAT: H4 has risen above the 200-period moving average MA(200), this is bullish.
- The Parabolic indicator gives a buy signal.
- The Donchian channel indicates uptrend: it is narrowing up.
- The MACD indicator gives a bullish signal: it is above the signal line and the gap is widening.
- The RSI oscillator has levelled off and has not reached the oversbought zone yet.
We believe the bullish momentum will continue after the price breaches above the upper boundary of Donchian channel at 524.3. This level can be used as an entry point for placing a pending order to buy. The stop loss can be placed below the last fractal low at 502.0. After placing the order, the stop loss is to be moved every day to the next fractal low, following Parabolic signals. Thus, we are changing the expected profit/loss ratio to the breakeven point. If the price meets the stop loss level (502.0) without reaching the order (524.3), we recommend cancelling the order: the market has undergone internal changes which were not taken into account.
Technical Analysis Summary
| Order | Buy |
| Buy stop | Above 524.3 |
| Stop loss | Below 502.0 |
- コースを取って、

【重要な注意事項】:
本レポートは、当社の親会社であるアイエフシーマーケットが作成したものの邦訳です。本レポートには、当社のサービスと商品についての情報を含みますが、お客様の投資目的、財務状況、資金力にかかわらず、情報の提供のみを目的とするものであり、金融商品の勧誘、取引の推奨、売買の提案等を意図したものではありません。 本レポートは、アイエフシーマーケットが信頼できると思われる情報にもとづき作成したものですが、次の点に十分ご留意ください。アイエフシーマーケットおよび当社は、本レポートが提供する情報、分析、予測、取引戦略等の正確性、確実性、完全性、安全性等について一切の保証をしません。アイエフシーマーケットおよび当社は、本レポートを参考にした投資行動が利益を生んだり損失を回避したりすることを保証または約束あるいは言外に暗示するものではありません。アイエフシーマーケットおよび当社は、本レポートに含まれる不確実性、不正確性、不完全性、誤謬、文章上の誤り等に起因して、お客様または第三者が損害(直接的か間接的かを問いません。)を被った場合でも、一切の責任を負いません。
