- マーケット分析
- テクニカル分析
WTI原油対円 テクニカル分析 - WTI原油対円 取引:2018-12-12
Japan's GDP fell according to results of the 3rd quarter
In this review, we suggest considering the personal composite instrument (PCI) &WTI/JPY. It reflects the price dynamics of the portfolio of futures on WTI oil against the Japanese yen. Will the WTI/JPY rise?
Such dynamics means the weakening of the yen and strengthening of oil. The United Auto Workers union has asked the US government to impose import duties on Japanese cars. Theoretically, President Donald Trump may take measures to reduce the trade surplus in favor of Japan, estimated at $ 69 billion per year. Earlier, he raised duties on Chinese goods in order to reduce the trade surplus in favor of China. An additional negative factor for the yen may be weak macroeconomic data. The decrease in Japan’s GDP in the 3rd quarter of 2018 was minus 2.5%, and it has been the maximum since the 2nd quarter of 2014. Oil prices may rise due to the decision of OPEC and non-OPEC producers to reduce oil production by 1.2 million barrels per day from January 1, 2019. In addition, according to the report by the Libyan National Oil Company, Libya may reduce oil production by 388 thousand barrels per day because of the actions of rebels in the El Sharara and El Feel fields.
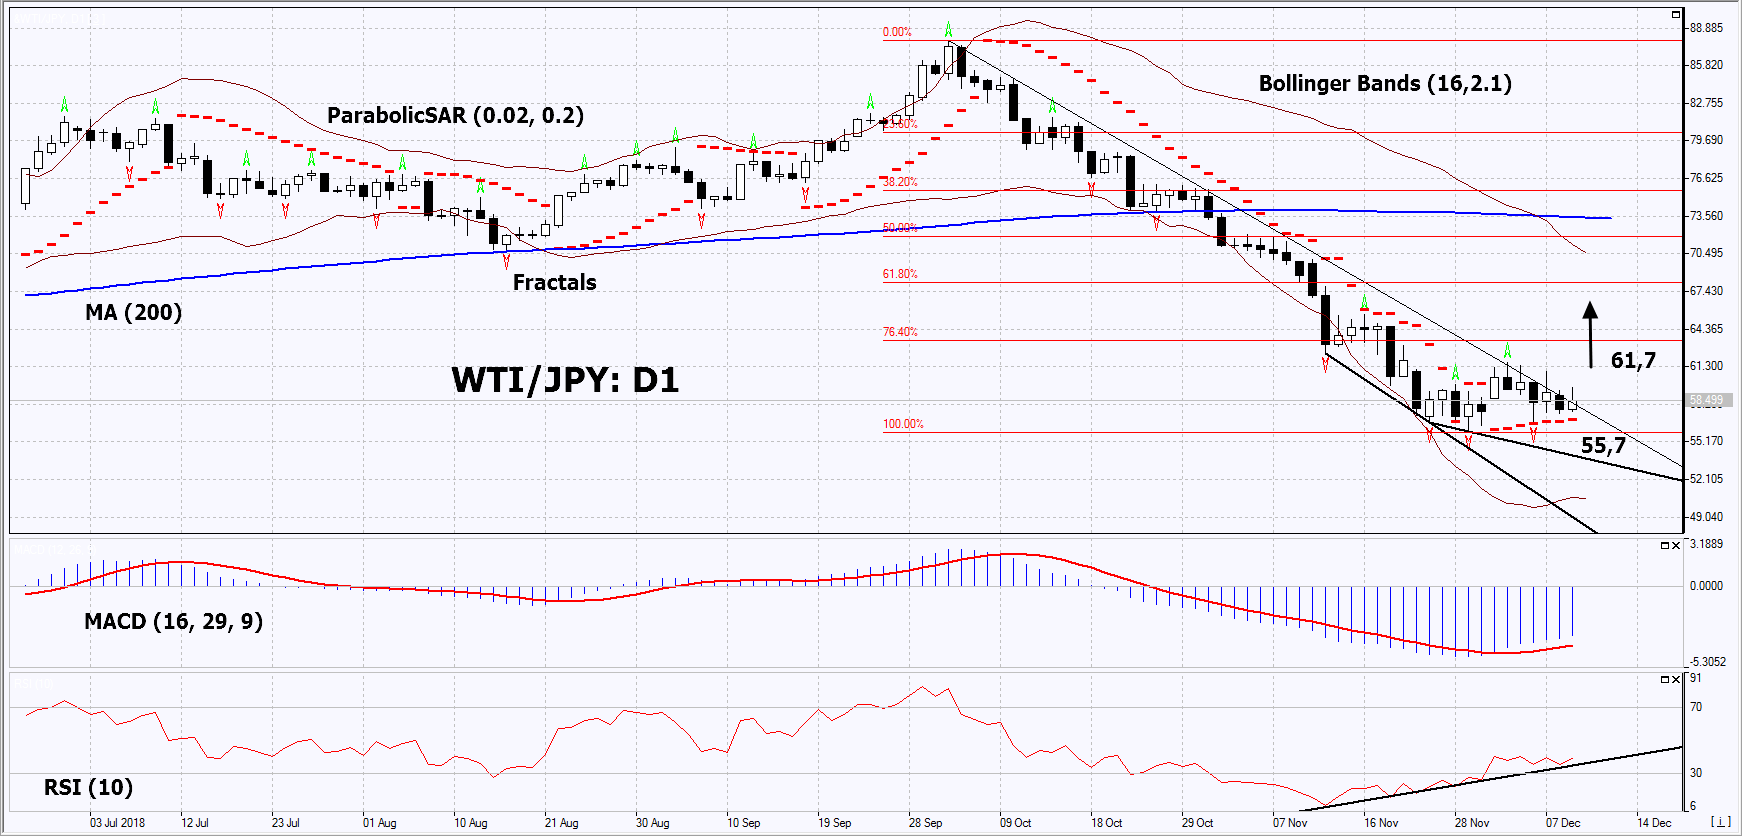
On the daily timeframe, WTI/JPY: D1 in a downtrend. It has approached its resistance line. A number of technical analysis indicators formed buy signals. The resistance line of the downtrend must be breached up before opening a buy position. The further price increase is possible in case of the publication of negative macroeconomic statistics in Japan and a reduction in world oil production.
- The Parabolic indicator gives a bullish signal.
- The Bollinger bands have widened strongly, which indicates high volatility. The lower band is titled upward.
- The RSI indicator is below 50. It has formed a double positive divergence.
- The MACD indicator gives a bullish signal.
The bullish momentum may develop in case WTI/JPY exceeds its last fractal high and the resistance line of the downtrend at 61.7. This level may serve as an entry point. The initial stop loss may be placed below the two last fractal lows, the Parabolic signal and the 14-month low at 55.7. After opening the pending order, we shall move the stop to the next fractal low following the Bollinger and Parabolic signals. Thus, we are changing the potential profit/loss to the breakeven point. More risk-averse traders may switch to the 4-hour chart after the trade and place there a stop loss moving it in the direction of the trade. If the price meets the stop level (55.7) without reaching the order (61.7), we recommend to close the position: the market sustains internal changes that were not taken into account.
Summary of technical analysis
| Position | Buy |
| Buy stop | Above 61.7 |
| Stop loss | Below 55.7 |
- コースを取って、

【重要な注意事項】:
本レポートは、当社の親会社であるアイエフシーマーケットが作成したものの邦訳です。本レポートには、当社のサービスと商品についての情報を含みますが、お客様の投資目的、財務状況、資金力にかかわらず、情報の提供のみを目的とするものであり、金融商品の勧誘、取引の推奨、売買の提案等を意図したものではありません。 本レポートは、アイエフシーマーケットが信頼できると思われる情報にもとづき作成したものですが、次の点に十分ご留意ください。アイエフシーマーケットおよび当社は、本レポートが提供する情報、分析、予測、取引戦略等の正確性、確実性、完全性、安全性等について一切の保証をしません。アイエフシーマーケットおよび当社は、本レポートを参考にした投資行動が利益を生んだり損失を回避したりすることを保証または約束あるいは言外に暗示するものではありません。アイエフシーマーケットおよび当社は、本レポートに含まれる不確実性、不正確性、不完全性、誤謬、文章上の誤り等に起因して、お客様または第三者が損害(直接的か間接的かを問いません。)を被った場合でも、一切の責任を負いません。
