- マーケット分析
- テクニカル分析
銀 テクニカル分析 - 銀 取引:2019-06-03
After China, the United States entered into a trade conflict with Mexico
Precious metals are becoming more expensive against the backdrop of expanding the geography of global trade wars. The United States can increase import duties not only for China, but also for Mexico. In addition, precious metals can be supported by a reduction in the Fed rate. Will the silver quotations increase?
US President Donald Trump announced a possible increase in import duties for Mexico in response to an increase in the number of illegal immigrants from this country. In his opinion, the Mexican authorities should more actively prevent the illegal emigration of their citizens to the United States. The first duty increase by 5% may already take place on June 10, and by October 1 they will gradually increase by 25%. According to rate futures traded on the Chicago CME, the probability of a Fed rate cut by the end of this year is 90%. Most likely this can be done in September. Thus, market participants believe that the Fed will continue monetary incentives for the economy. Reducing the rate can weaken the dollar and increase the attractiveness of precious metals for investment. Silver is far behind the growth of quotations from gold. The gold / silver price ratio peaked from the 90s.
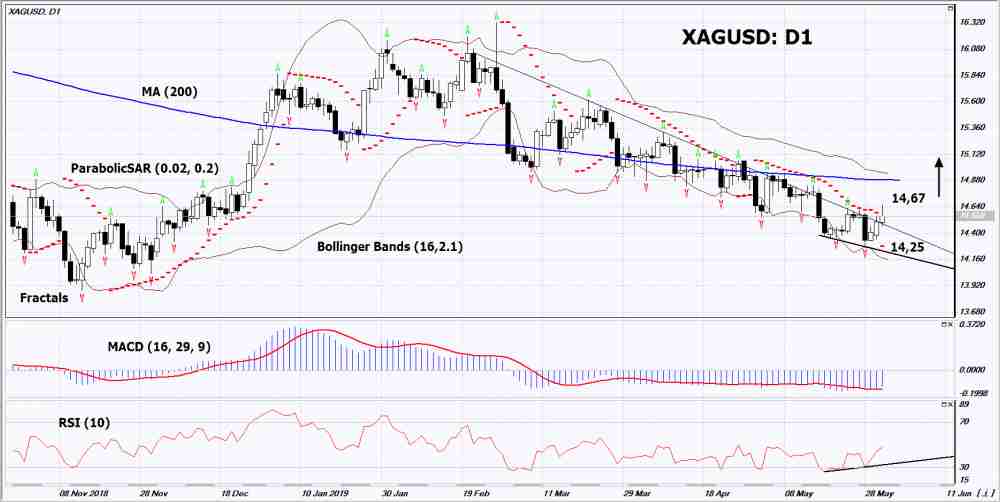
On the daily timeframe XAGUSD: D1 came out of the downtrend. Various technical analysis indicators have generated an uptrend signal. Further growth of quotations is possible in case of an increase in demand for precious metals.
- The Parabolic indicator shows uptrend signal.
- The Bolinger bands expanded, indicating high volatility. Both Bollinger lines are sloping down.
- The RSI indicator is below 50. It has formed a divergence to the increase.
- The MACD indicator gives bullish signal.
The bullish momentum may develop in case if XAGUSD exceeds its last maximum: 14.67. This level may serve as an entry point. The initial stop loss may be placed below the last two lower fractals and the Parabolic signal: 14,25. After opening the pending order, we shall move the stop to the next fractal low following the Bollinger and Parabolic signals. Thus, we are changing the potential profit/loss to the breakeven point. More risk-averse traders may switch to the 4-hour chart after the trade and place a stop loss moving it in the direction of the trade. If the price meets the stop level (14,25) without reaching the order (14,67), we recommend to cancel the order: the market sustains internal changes that were not taken into account.
Technical Analysis Summary
| Position | Buy |
| Buy stop | Above 14,67 |
| Stop loss | Below 14,25 |
- コースを取って、

【重要な注意事項】:
本レポートは、当社の親会社であるアイエフシーマーケットが作成したものの邦訳です。本レポートには、当社のサービスと商品についての情報を含みますが、お客様の投資目的、財務状況、資金力にかかわらず、情報の提供のみを目的とするものであり、金融商品の勧誘、取引の推奨、売買の提案等を意図したものではありません。 本レポートは、アイエフシーマーケットが信頼できると思われる情報にもとづき作成したものですが、次の点に十分ご留意ください。アイエフシーマーケットおよび当社は、本レポートが提供する情報、分析、予測、取引戦略等の正確性、確実性、完全性、安全性等について一切の保証をしません。アイエフシーマーケットおよび当社は、本レポートを参考にした投資行動が利益を生んだり損失を回避したりすることを保証または約束あるいは言外に暗示するものではありません。アイエフシーマーケットおよび当社は、本レポートに含まれる不確実性、不正確性、不完全性、誤謬、文章上の誤り等に起因して、お客様または第三者が損害(直接的か間接的かを問いません。)を被った場合でも、一切の責任を負いません。
