- マーケット分析
- テクニカル分析
銀対MXN テクニカル分析 - 銀対MXN 取引:2019-05-14
Getting ready for the bank of Mexico meeting
In this review, we suggest to consider the Silver vs. MXN personal composite instrument (PCI). It reflects the price dynamics of silver against the Mexican peso. Will the XAGMXN quotations grow?
Such dynamics means the rise in silver prices and the weakening of the Mexican peso. May 16, 2019 will be the next meeting of the Bank of Mexico. According to futures quotes, the probability of a rate reduction exceeds 75%. This can have a negative effect on peso dynamics. Inflation in Mexico is 4.41% in annual terms, which is above the target range of the Bank of Mexico (3% plus or minus 1%). However, the current rate is almost 2 times higher than this indicator and is now equal to 8.25%. It is expected to decrease to 8%. In turn, precious metals are becoming more expensive against the backdrop of increasing global political risks and another exacerbation of the US-Chinese trade war.
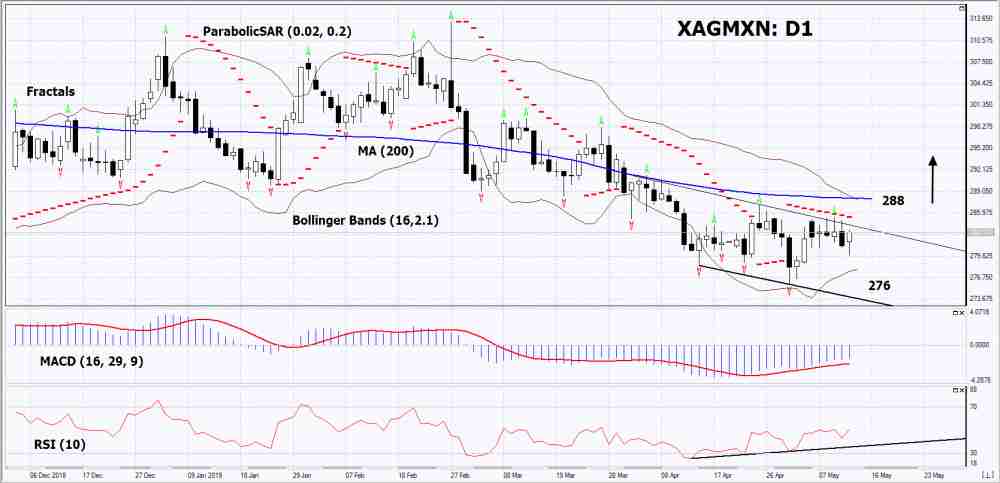
On the daily timeframe, XAGMXN: D1 adjusted to the top of a 6-month low. It approached the resistance line of the downward trend, which needs to be pushed upward before opening a buy position. Most of the technical analysis indicators showed an uptrend signal. Further growth is possible if high demand for precious metals remains and the Bank of Mexico rate decreases.
- The Parabolic indicator demonstrates the signal to decrease. It can be used as a resistance level that must be overcome before opening a buy position.
- The Bollinger bands narrowed, indicating volatility decrease . The bottom line of Bollinger has a slope up.
- The RSI indicator is above the 50 mark. It has formed a divergence to the rise.
- The MACD indicator indicates a signal to increase.
The bullish momentum may develop if XAGMXN will exceed its last two upper fractals, the Parabolic signal, the 200-day moving average line and the upper Bollinger line: 288.This level may serve as an entry point. The initial stop loss may be placed below the last lower fractal, the bottom Bollinger line and the 6-month minimum: 276. After opening the pending order, we shall move the stop to the next fractal low following the Bollinger and Parabolic signals to the next fractal minimum. Thus, we are changing the potential profit/loss to the breakeven point. More risk-averse traders may switch to the 4-hour chart after the trade and place there a stop loss moving it in the direction of the trade. If the price meets the stop level (276) without reaching the order (288), we recommend to close the position: the market sustains internal changes that were not taken into account.
Summary of technical analysis
| Position | Buy |
| Buy stop | Above 288 |
| Stop loss | Below 276 |
- コースを取って、

【重要な注意事項】:
本レポートは、当社の親会社であるアイエフシーマーケットが作成したものの邦訳です。本レポートには、当社のサービスと商品についての情報を含みますが、お客様の投資目的、財務状況、資金力にかかわらず、情報の提供のみを目的とするものであり、金融商品の勧誘、取引の推奨、売買の提案等を意図したものではありません。 本レポートは、アイエフシーマーケットが信頼できると思われる情報にもとづき作成したものですが、次の点に十分ご留意ください。アイエフシーマーケットおよび当社は、本レポートが提供する情報、分析、予測、取引戦略等の正確性、確実性、完全性、安全性等について一切の保証をしません。アイエフシーマーケットおよび当社は、本レポートを参考にした投資行動が利益を生んだり損失を回避したりすることを保証または約束あるいは言外に暗示するものではありません。アイエフシーマーケットおよび当社は、本レポートに含まれる不確実性、不正確性、不完全性、誤謬、文章上の誤り等に起因して、お客様または第三者が損害(直接的か間接的かを問いません。)を被った場合でも、一切の責任を負いません。
