- マーケット分析
- テクニカル分析
金 テクニカル分析 - 金 取引:2017-05-11
Fed policy tightening weighs on gold prices
Inflation near Fed’s target threshold 2% and strong labor market support Fed policy tightening. This will strengthen the US dollar and pressure gold. Will gold continue falling?
The win by centrist Emmanuel Macron in French presidential election runoff on May 7 removed the major political uncertainty supporting gold prices recently. The defeat of National Front leader Marine Le Pen eliminated the danger to European Union integrity: Marine Le Pen had vowed to hold a referendum on European Union membership in six months time if she won. She also supported abandoning euro. With a major bullish factor removed, gold prices remain subject to the same bearish factor – tightening of Fed monetary policy. On Tuesday Kansas City Fed President Esther George said the central bank should still stick to gradually raising rates despite some recent soft data such as low first quarter GDP at 0.7% annual rate and lower auto sales. George supported also shrinking Fed’s balance sheet later this year by reducing reinvestments in maturing mortgage-backed securities and long-term Treasury securities. In last week’s FOMC statement central bank policy makers deemed first quarter GDP as ‘transitory’, noting that consumer spending continued to be solid, business investment had firmed and inflation has been "running close" to the Fed's target. According to the CME’s FedWatch tool, fed fund futures traders are pricing in an 88% chance of a rate increase at the US central bank’s June 14 meeting.
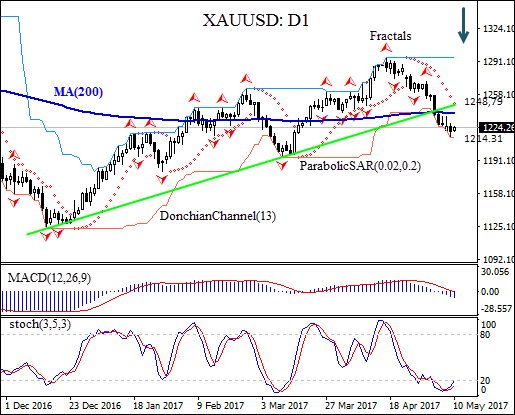
The XAUUSD: D1 has fallen below the 200-day moving average MA(200) on the daily chart, and the support line of the uptrend.
- Parabolic indicator gives a sell signal.
- The Donchian channel indicates no trend yet: it is flat.
- The MACD indicator is bearish.
- The stochastic oscillator is rising from the oversold zone.
We believe the bearish momentum will continue after the price closes below the lower Donchian boundary at $1214.31. A pending order to sell can be placed below that level. The stop loss can be placed above the Parabolic signal at $1248.79. After placing the order, the stop loss is to be moved every day to the next fractal high, following Parabolic signals. Thus, we are changing the probable profit/loss ratio to the breakeven point. The most risk-averse traders may switch to the 4-hour chart after the trade and place there a stop-loss moving it in the direction of the trade. If the price meets the stop loss level ($1248.79) without reaching the order ($1214.31), we recommend canceling the position: the market sustains internal changes which were not taken into account.
Technical Analysis Summary
| Position | Sell |
| Sell stop | Below 1214.31 |
| Stop loss | Above 1248.79 |
- コースを取って、

【重要な注意事項】:
本レポートは、当社の親会社であるアイエフシーマーケットが作成したものの邦訳です。本レポートには、当社のサービスと商品についての情報を含みますが、お客様の投資目的、財務状況、資金力にかかわらず、情報の提供のみを目的とするものであり、金融商品の勧誘、取引の推奨、売買の提案等を意図したものではありません。 本レポートは、アイエフシーマーケットが信頼できると思われる情報にもとづき作成したものですが、次の点に十分ご留意ください。アイエフシーマーケットおよび当社は、本レポートが提供する情報、分析、予測、取引戦略等の正確性、確実性、完全性、安全性等について一切の保証をしません。アイエフシーマーケットおよび当社は、本レポートを参考にした投資行動が利益を生んだり損失を回避したりすることを保証または約束あるいは言外に暗示するものではありません。アイエフシーマーケットおよび当社は、本レポートに含まれる不確実性、不正確性、不完全性、誤謬、文章上の誤り等に起因して、お客様または第三者が損害(直接的か間接的かを問いません。)を被った場合でも、一切の責任を負いません。
