- Analiz
- Teknik analiz
EUR/USD Teknik Analiz - EUR/USD Ticaret: 2015-06-29
Creek-style crisis
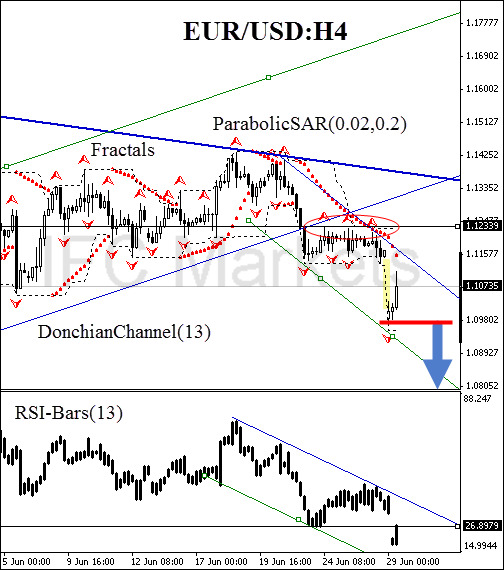
The eurozone crisis continues. On Saturday the Greek government and European creditors did not manage to come to a compromise on additional financial aid and credit easing. The financial bailout program expires on June, 30. We can literally assume that Greece is on the brink of default while eurozone is close to a political crisis. The EUR/USD currency pair opened with a bearish gap on Monday. The price has been moving within the H4 and daily trends that both have a negative slope. The instrument has three times approached the support line at 1.12339 but has not yet crossed it. As a result, the bearish triple top pattern has been shaped. The Parabolic indicator has been moving inside the H4 corridor, confirming the trend. The RSI-Bars oscillator does not contradict our assumptions. We are expecting the next bar to close below the resistance level at 27%.

We believe that all the represented instruments have been giving sell signals. The terminal impulse is anticipated after breaching the 27% oscillator support, which corresponds to the Donchian Channel lower boundary and the fractal at 1.09802. A sell pending order may be placed at this mark. A stop loss may be placed at the channel opposite boundary at 1.12339. This level is supported by Parabolic historical values, the pattern and the trend line. The stop loss is supposed to be moved every four hours near the next fractal high, following Parabolic signals. Thus, we are changing the probable profit/loss ratio to the breakeven point.
| Position | Sell |
| Sell stop | below 1.09802 |
| Stop loss | above 1.12339 |
Not:
Bu bilgilendirici ve eğitici bir genel bakıştır ve ücretsiz olarak yayımlanmaktadır. Burada yer alan tüm veriler kamu kaynaklarından alınmış ve az çok güvenilir olarak kabul edilmiştir. Aynı zamanda, bilgilerin tam ve doğru olduğuna dair hiçbir garanti yoktur. Gelecekte bunlar güncellenmemektedirler. Görüşler, göstergeler, grafikler ve kalan her şey dahil olmak üzere her genel bakışta olan tüm bilgiler sadece değerlendirme amacıyla sağlanıp mali dalışmanlık veya tavsiye niteliğinde değildirler. Tüm metin ve onun herhangi bir bölümünü veya grafikleri herhangi bir varlıkla işlem yapmak için bir teklif olarak kabul edilemez. IFC Markets şirketi ve şirket çalışanları bu genel bakışın incelenmesi sırasında veya sonrasında başkası tarafından alınan herhangi bir eylem için hiçbir koşulda sorumlu değildir.

