- Analiz
- Teknik analiz
Teknik Analiz - Ticaret: 2015-05-19
Wheat prices to go up
Today we would like to examine the personal composite instrument &WHEAT/RUB. Its base part contains wheat CFD and the quoted one includes the Russian ruble. In fact, this PCI represents the price of wheat in rubles. As seen on the chart, it hit the lows of last November. Meanwhile, the cumulative inflation in Russia over five months, expressed in rubles, made up 11.6%. This is one of the reasons for a possible WHEAT/RUB price growth. The second factor may be a possible rise in wheat prices on the world market because of bad weather conditions, in case of El Nino appears this year. Wheat prices reached a six-week high on Monday. Now there is a pullback as the dollar strengthened and rainy weather in the US Midwest was forecasted by Commodity Weather Group. Worth paying attention to the fact that the current rating of the US wheat crop quality is highly estimated, much higher than the average annual values. In this way, the price just can’t go up further, but it can slump (in case of El Nino).
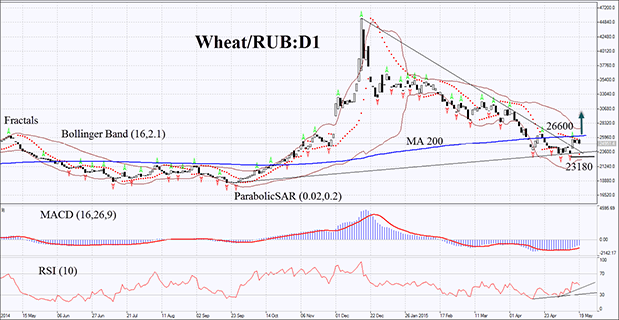
The &WHEAT/RUB instrument indicates signs of price rise on the daily chart: it broke the bearish resistance line. Bollinger Bands narrowed, which may stand for a reduction in volatility. MACD histogram is below the signal line and the zero level, which is a bullish signal. Parabolic also showed a buy signal. RSI bars are rising and formed a bullish divergence. It has not broken the level of 50. There is a possibility of further bullish momentum development after a &Grain_4 candlestick is being closed above Parabolic points and the last two fractal highs at 25650 and 26600. At the same time, the price should overcome the moving average (200). Stop loss is to be placed below the first-formed Parabolic point, which can currently act as a support line, and below the two fractal lows at 23180. After pending order placing, Stop loss is to be moved every four hours to the next fractal low, following Parabolic and Bollinger signals. Thus, we are changing the probable profit/loss ratio to the breakeven point. The most careful traders can switch to the H4 timeframe after order execution, placing Stop loss and moving it according to the price direction. If the price meets the Stop loss level without reaching the order, we recommend cancelling the position: the market sustains internal changes which were not considered.
| Position | Buy |
| Buy stop | above 25650 or 26600 |
| Stop loss | below 23180 |
- Sertifika Al

Not:
Bu bilgilendirici ve eğitici bir genel bakıştır ve ücretsiz olarak yayımlanmaktadır. Burada yer alan tüm veriler kamu kaynaklarından alınmış ve az çok güvenilir olarak kabul edilmiştir. Aynı zamanda, bilgilerin tam ve doğru olduğuna dair hiçbir garanti yoktur. Gelecekte bunlar güncellenmemektedirler. Görüşler, göstergeler, grafikler ve kalan her şey dahil olmak üzere her genel bakışta olan tüm bilgiler sadece değerlendirme amacıyla sağlanıp mali dalışmanlık veya tavsiye niteliğinde değildirler. Tüm metin ve onun herhangi bir bölümünü veya grafikleri herhangi bir varlıkla işlem yapmak için bir teklif olarak kabul edilemez. IFC Markets şirketi ve şirket çalışanları bu genel bakışın incelenmesi sırasında veya sonrasında başkası tarafından alınan herhangi bir eylem için hiçbir koşulda sorumlu değildir.
