- Analiz
- Teknik analiz
Altın Teknik Analiz - Altın Ticaret: 2015-03-03
Gold chart
Today let’s consider XAUUSD on the H4 chart. In February gold hit the 5-month low over expectations of an early Fed rate hike for the first time since 2006. Some market participants deem that this might be done in April. However, last week the Fed Chair said there was no need to raise interest rates that early. There is no specific timing and this issue will be discussed on a regular basis at meetings. This appeared to be the reason the majority of investors decided that the interest rates might be raised only in June. After that the gold price stabilized above $1200 per ounce. We don’t rule out the possibility of gold to advance due to high demand in China and India. Note that the US dollar index hit the 11-year high. If it slides, that might also provide support for precious metals.
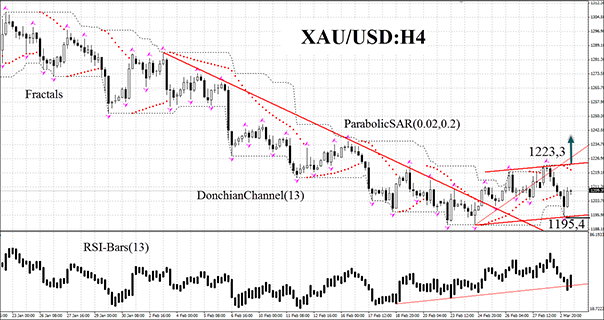
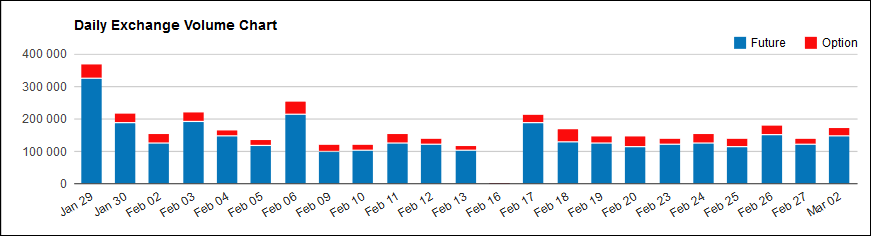
XAU/USD finished the four-week downtrend, breaking the corresponding resistance level. Now it shows weak signs for bullish hopes and remains in the price channel. RSI-Bars showed bullish divergence: the latest bars are located below 50. This may be a sign that it is too early to go long. We do not exclude the bullish momentum being developed further after the breakout of the upper price channel boundary that coincides with the DonchianChannel upper level and the latest fractal high at 1223.3: this level can be used for placing a pending buy order. Stop loss is to be placed at the lower border of DonchianChannel that coincides with the lower border of the price channel and the latest fractal low, which can currently act as the support line at 1195.4. After pending order placing, Stop loss is to be moved every four hours near the next fractal low, following Parabolic signals. Thus, we are changing the probable profit/loss ratio to the breakeven point. If the price meets Stop loss level without reaching the order, we recommend cancelling the position: market sustains internal changes which were not considered. For the trading volume data please click here.
| Position | Buy |
| Buy stop | above 1223.3 |
| Stop loss | below 1195.4 |
Dear traders. For the detailed report of the strategy based on analytical issues of technical analysis click here.
- Sertifika Al

Not:
Bu bilgilendirici ve eğitici bir genel bakıştır ve ücretsiz olarak yayımlanmaktadır. Burada yer alan tüm veriler kamu kaynaklarından alınmış ve az çok güvenilir olarak kabul edilmiştir. Aynı zamanda, bilgilerin tam ve doğru olduğuna dair hiçbir garanti yoktur. Gelecekte bunlar güncellenmemektedirler. Görüşler, göstergeler, grafikler ve kalan her şey dahil olmak üzere her genel bakışta olan tüm bilgiler sadece değerlendirme amacıyla sağlanıp mali dalışmanlık veya tavsiye niteliğinde değildirler. Tüm metin ve onun herhangi bir bölümünü veya grafikleri herhangi bir varlıkla işlem yapmak için bir teklif olarak kabul edilemez. IFC Markets şirketi ve şirket çalışanları bu genel bakışın incelenmesi sırasında veya sonrasında başkası tarafından alınan herhangi bir eylem için hiçbir koşulda sorumlu değildir.
