

- Analytics
- Market Data
- Indices Prices
- Live Chart
Chart and Live Prices Today
This page includes full information about the GB 100 Index, including the GB 100 Index live chart and dynamics on the chart by choosing any of 8 available time frames.
By moving the start and end of the timeframe in the bottom panel you can see both the current and the historical price movements of the instrument. In addition, you have an opportunity to choose the type of display of the GB 100 Index live chart – Candles or Lines chart – through the buttons in the upper left corner of the chart. All clients that have not yet decided which instrument to trade are in the right place since reading the full characteristics of the GB100 and watching its performance on the charts will help them to make their final decision.
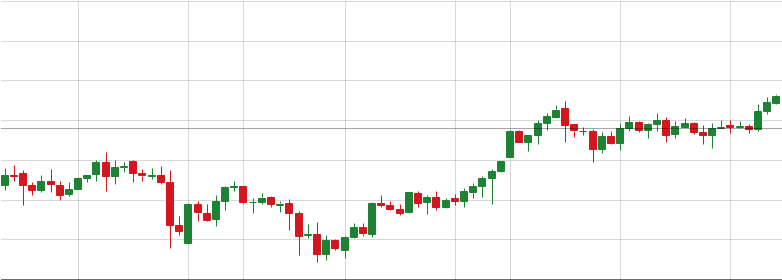
Live Chart
- 1m
- 5m
- 15m
- 30m
- 1h
- 4h
- 1d
- 1w
The Price of GB 100 Index is Rising This Week
GB 100 Index is currently trading at 10718.66, up 0.59% since yesterday. Looking at broader trends, it's shifted 0.46% this week and 0.56% over the last 30 days.
| Select Period or Date Range | Open price | Change % |
|---|---|---|
| Daily | 10657.54 | 0.59% |
| Weekly | 10578.1 | 0.46% |
| Monthly | 10637.8419 | 0.56% |
Technical Analysis
Technical analysis is a method of studying and evaluating market dynamics based on the price history. Its main purpose is to forecast price dynamics of a financial instrument in future through technical analysis tools. Technical analysts use this method of market analysis to forecast the prices of different currencies and currency pairs. This type of the analysis will allow you to make market forecast based on studying historical prices of the trading instruments.
See also latest technical analysis of the price dynamics of GB100 Pound: GB100 forecast.
News

Three Things Moving Markets This Week
There's a lot going on in the world economy right now, American jobs, Chinese trade and British stock index . The big event...