- Analytics
- Technical Analysis
EUR USD Technical Analysis - EUR USD Trading: 2015-01-08
Free-falling
The inflation data released yesterday in the EU added strong pressure on the euro: the monthly released Consumer Price Index CPI indicated negative trend. In annual terms the index lost 0.2%, confirming the worst investor concerns. Deflation in the euro zone is becoming real, and it means there are more chances for the ECB to start the promised money printing. Even more pressure on the euro was added by the Wednesday’s shooting in France and no significant progress in catching the suspects. Today at 14:30 CET we expect the release of Unemployment Claims in the US. The report is released weekly by the US Department of Labor. The indicator allows estimating the domestic demand dynamics and the consumer loan potential for the US economy stimulus. If the indicator performance is better than the one released earlier (298 thousand contracts), it may lead to the euro plunge against the greenback.
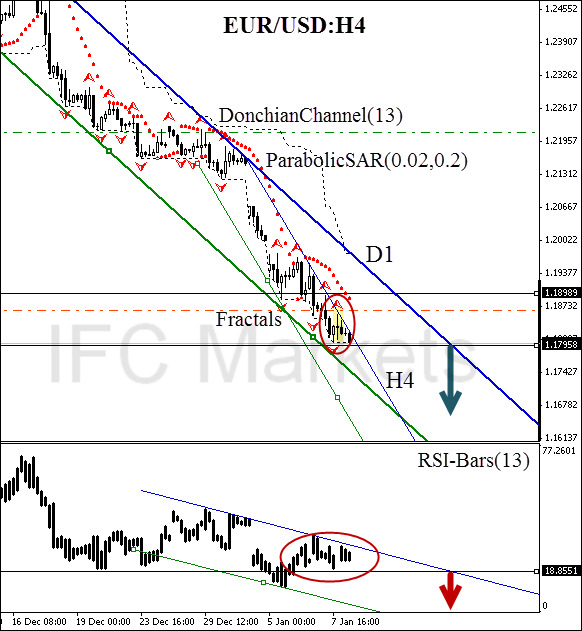
Here we consider EUR/USD currency pair on the H4 chart. The last euro retracement finished with the doji candlestick pattern (marked in red ellipse on the chart). Bulls are completely exhausted and right after a timid surge, the euro continued free-falling. However, nearby there is the daily resistance line which can cause a slight retracement: you should be careful. Fortunately, we have RSI-Bars oscillator at hand, so it can filter the false breakout. Now its values are located inside the bearish triangle. We would wait for a significant price channel breakout after the oscillator crosses 18.8551%. It is more likely to happen after the price intersection of the fractal support at 1.17957. This mark can be used by aggressive traders for placing a pending sell order, but we recommend them to monitor the oscillator chart. Stop Loss can be placed at 1.8989. This mark is confirmed by Parabolic historical values and Bill Williams fractal. After order execution, Stop Loss is to be moved near the next fractal high. Thus, we are changing the probable profit/loss ratio to the breakeven point.
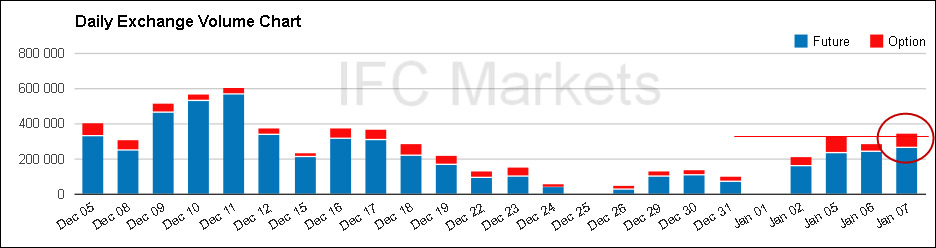
However, the situation of a strong retracement has little chances to happen. According to the figure, the volume of euro futures traded on the Chicago Mercantile Exchange is going up, confirming the trend. To monitor the volumes click here.
Dear traders. For the detailed report of the strategy based on analytical issues of technical analysis click here.
Explore our
Trading Conditions
- Spreads from 0.0 pip
- 30,000+ Trading Instruments
- Stop Out Level - Only 10%
Ready to Trade?
Open Account Note:
This overview has an informative and tutorial character and is published for free. All the data, included in the overview, are received from public sources, recognized as more or less reliable. Moreover, there is no guarantee that the indicated information is full and precise. Overviews are not updated. The whole information in each overview, including opinion, indicators, charts and anything else, is provided only for familiarization purposes and is not financial advice or а recommendation. The whole text and its any part, as well as the charts cannot be considered as an offer to make a deal with any asset. IFC Markets and its employees under any circumstances are not liable for any action taken by someone else during or after reading the overview.
