- Analytics
- Technical Analysis
Nikkei Index Technical Analysis - Nikkei Index Trading: 2018-01-25
The strengthening of the yen may obstruct Japanese exporters
The products of the Japanese exporters may become less competitive on the background of the strengthening of the yen to the 4-month high. Will the Nikkei stock index drop?
The Japanese currency strengthened against the US dollar by 3.5% in 2 weeks and tested the psychological level of 109 yen per dollar. In its turn, Nikkei reached the psychological level of 24,000 points for the first time in 26 years, but has not been able to settle above it yet. An additional negative was the increase in world oil prices. On this background, the stocks of the Japanese transportation, petrochemical and construction companies dropped. On Friday morning important inflation data for December will be released in Japan, which may affect the dynamics of the yen and Nikkei. Meanwhile, a slight increase in consumer prices is expected.
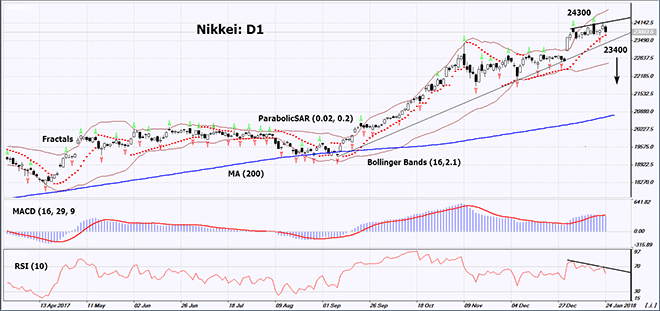
On the daily timeframe, Nikkei: D1 is in the rising trend, but its growth has slowed down and a number of technical analysis indicators formed bullish signals. A downward correction is possible in case of the publication of weak corporate data and the further strengthening of the yen.
- The Parabolic indicator gives a bullish signal. It may be used as an additional support level, which needs to be overcome to open a Sell position.
- The Bollinger bands have widened, which means higher volatility.
- The RSI indicator is above 50. It has formed a negative divergence.
- The MACD indicator gives a bearish signal.
The bearish momentum may develop in case Nikkei drops below the support line of the rising trend, the last fractal low and the Parabolic signal at 23400. This level may serve as an entry point. The initial stop loss may be placed above the last fractal high and the 26-year high at 24300. After opening the pending order, we shall move the stop to the next fractal high following the Bollinger and Parabolic signals. Thus, we are changing the potential profit/loss to the breakeven point. More risk-averse traders may switch to the 4-hour chart after the trade and place there a stop loss moving it in the direction of the trade. If the price meets the stop level at 24300 without reaching the order at 23400, we recommend cancelling the position: the market sustains internal changes that were not taken into account.
Summary of technical analysis
| Position | Sell |
| Sell stop | below 23400 |
| Stop loss | above 24300 |
Explore our
Trading Conditions
- Spreads from 0.0 pip
- 30,000+ Trading Instruments
- Stop Out Level - Only 10%
Ready to Trade?
Open Account Note:
This overview has an informative and tutorial character and is published for free. All the data, included in the overview, are received from public sources, recognized as more or less reliable. Moreover, there is no guarantee that the indicated information is full and precise. Overviews are not updated. The whole information in each overview, including opinion, indicators, charts and anything else, is provided only for familiarization purposes and is not financial advice or а recommendation. The whole text and its any part, as well as the charts cannot be considered as an offer to make a deal with any asset. IFC Markets and its employees under any circumstances are not liable for any action taken by someone else during or after reading the overview.
