- Analytics
- Technical Analysis
Technical Analysis - Trading: 2014-11-14
Anti-dollar index
Today we consider the currency anti-dollar index &VSUSD_Index composed on the basis of the Personal Composite Instrument - PCI technology. The currency index is designed to show the USD fluctuations against other segment of the Forex market. As a systematic FX market indicator we will use a portfolio of the most liquid currencies traded against USD: [EUR(12.7%) + JPY(14.5%) + GBP(17.5%) + CHF(19.1%) + AUD(18.1%) + CAD(18.1%)]/USD. The price of each currency is expressed in USD. The weights are defined according to the currency liquidity relative to the volume of international bank circulation. Get more details and the online index chart by clicking on the anti-dollar index page &VSUSD_Index.
Note that &VSUSD_Index reaction on the US fundamental economic events is the most obvious and sustainable: the index forms a stable trend channel, meanwhile it is less susceptible to the fundamental events of other currencies. Let us remind you that today Core Retail Sales is to be released in the US. The indicator is released by the US Census Bureau every month and indicates the relative change in the retail sales volume of all the goods (except for cars), which amounts to 20% of the total volume. CRS is the monthly measurement indicator of all goods sold by retailers based on the retail stores sampling of different types. The index defines the consumer confidence and demand, and therefore, it can affect significantly investor preferences. Currently, &VSUSD_Index is waiting for new fundamental signals, and it is still in a state of uncertainty.
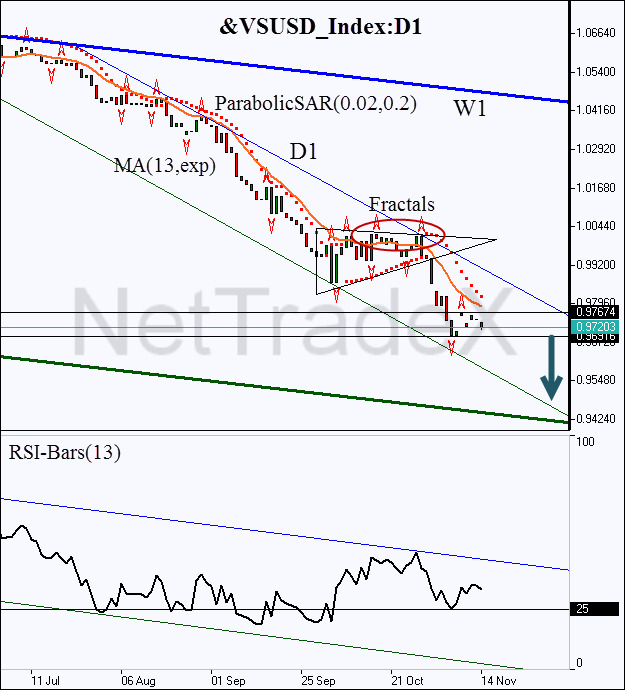
After position opening, Stop Loss is to be moved after the Parabolic values, near the next fractal high. Updating is enough to be done every day after a new Bill Williams fractal formation (5 candlesticks). Thus, we are changing the probable profit/loss ratio to the breakeven point.
| Position | Sell |
| Sell stop | below 0.96916 |
| Stop loss | above 0.97674 |
More information about the mechanism of portfolio operations is available on our website section “Quick Guide for Creating and Trading PCI”.
Explore our
Trading Conditions
- Spreads from 0.0 pip
- 30,000+ Trading Instruments
- Stop Out Level - Only 10%
Ready to Trade?
Open Account Note:
This overview has an informative and tutorial character and is published for free. All the data, included in the overview, are received from public sources, recognized as more or less reliable. Moreover, there is no guarantee that the indicated information is full and precise. Overviews are not updated. The whole information in each overview, including opinion, indicators, charts and anything else, is provided only for familiarization purposes and is not financial advice or а recommendation. The whole text and its any part, as well as the charts cannot be considered as an offer to make a deal with any asset. IFC Markets and its employees under any circumstances are not liable for any action taken by someone else during or after reading the overview.
