- Analytik
- Technische Analyse
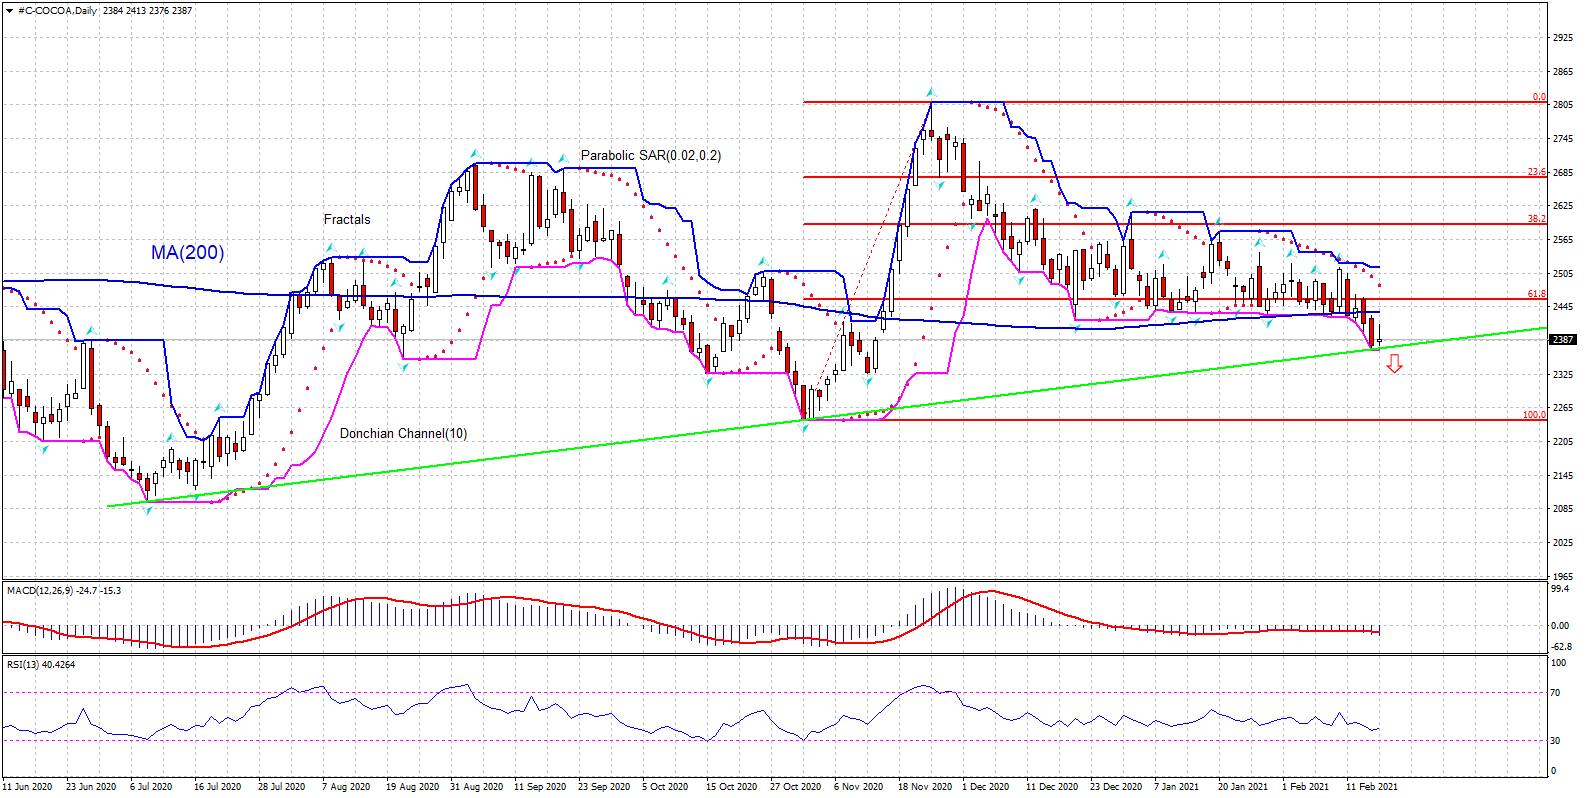
Kakao Technische Analyse - Kakao Handel: 2021-02-19
Kakao Technical Analysis Summary
Below 2367
Sell Stop
Above 2516
Stop Loss
| Indicator | Signal |
| RSI | Neutral |
| MACD | Sell |
| Donchian Channel | Neutral |
| MA(200) | Sell |
| Fractals | Neutral |
| Parabolic SAR | Sell |
Kakao Chart Analysis
Kakao Technische Analyse
The #C-COCOA technical analysis of the price chart on daily timeframe shows #C-COCOA: D1 is falling under the 200-day moving average MA(200) which has leveled off. We believe the bearish momentum will continue after the price breaches below the lower Donchian boundary at 2367. This level can be used as an entry point for placing a pending order to sell. The stop loss can be placed above 2516. After placing the pending order the stop loss is to be moved every day to the next fractal high, following Parabolic signals. Thus, we are changing the expected profit/loss ratio to the breakeven point. If the price meets the stop-loss level (2516) without reaching the order (2367) we recommend cancelling the order: the market sustains internal changes which were not taken into account.
Fundamentale Analyse Rohstoffe - Kakao
The International Cocoa Organization forecast larger global cocoa surplus for 2020/21. Will the cocoa price slide continue?
The International Cocoa Organization (ICCO) forecast on Wednesday a global 2020/21 cocoa surplus of 100,000 metric tons(MT), wider than the 19,000 MT surplus from 2019/20. And yesterday the Ivory Coast government raised its 2021 Ivory Coast cocoa main crop estimate to 1.65 million MT, which is 100,000 MT more than its October estimate. Estimates of ample cocoa supplies is bearish for cocoa prices. On the other hand Gepex, an Ivory Coast's exporters group that includes six of the world's biggest cocoa grinders, reported last Friday that its January cocoa processing rose 7.4% over year to 52,053 MT. Signs of stronger global cocoa demand are upside risk for cocoa prices.
Explore our
Trading Conditions
- Spreads from 0.0 pip
- 30,000+ Trading Instruments
- Stop Out Level - Only 10%
Ready to Trade?
Open Account Hinweis:
Diese Übersicht hat einen informativen und Tutorencharakter und wird kostenlos veröffentlicht. Alle Daten, die in dieser Übersicht eingeschlossen sind, sind von mehr oder weniger zuverlässigen öffentlichen Quellen erhalten. Außerdem gibt es keine Garantie, dass die angezeigte Information voll und genau ist. Die Übersichten werden nicht aktualisiert. Die ganze Information in jeder Übersicht, einschließlich Meinungen, Hinweise, Charts und alles andere, werden nur für Vertrautmachen veröffentlicht und sind keine Finanzberatung oder Empfehlung. Der ganze Text und sein jeder Teil sowie die Charts können nicht als ein Geschäftsangebot betrachtet werden. Unter keinen Umständen sind IFC Markets und seine Angestellten für die Handlungen, die von jemand anderem während oder nach dem Lesen der Übersicht genommen werden, verantwortlich.

