- Analytics
- Technical Analysis
Australian Stock Index Technical Analysis - Australian Stock Index Trading: 2018-07-12
Trade wars may reduce the demand for Australian raw materials
China accounts for more than a quarter of Australia’s exports. Will prices of the Australian stock index S&P/ ASX 200 fall amid the strengthening of the China-US trade war?
In the structure of Australia's exports, mining products account for 32%. Fuel accounts for 28% and food products together with agricultural raw materials - 18.5%. China is the most important buyer. The limitation of the supply of Chinese goods to the US may reduce the demand for Australian raw materials. The plans of the Reserve Bank of Australia to raise the discount rate may be additional negative factors for S & P / ASX 200. Currently, it is at a historically low level of 1.5% with an annual inflation of 1.9%.
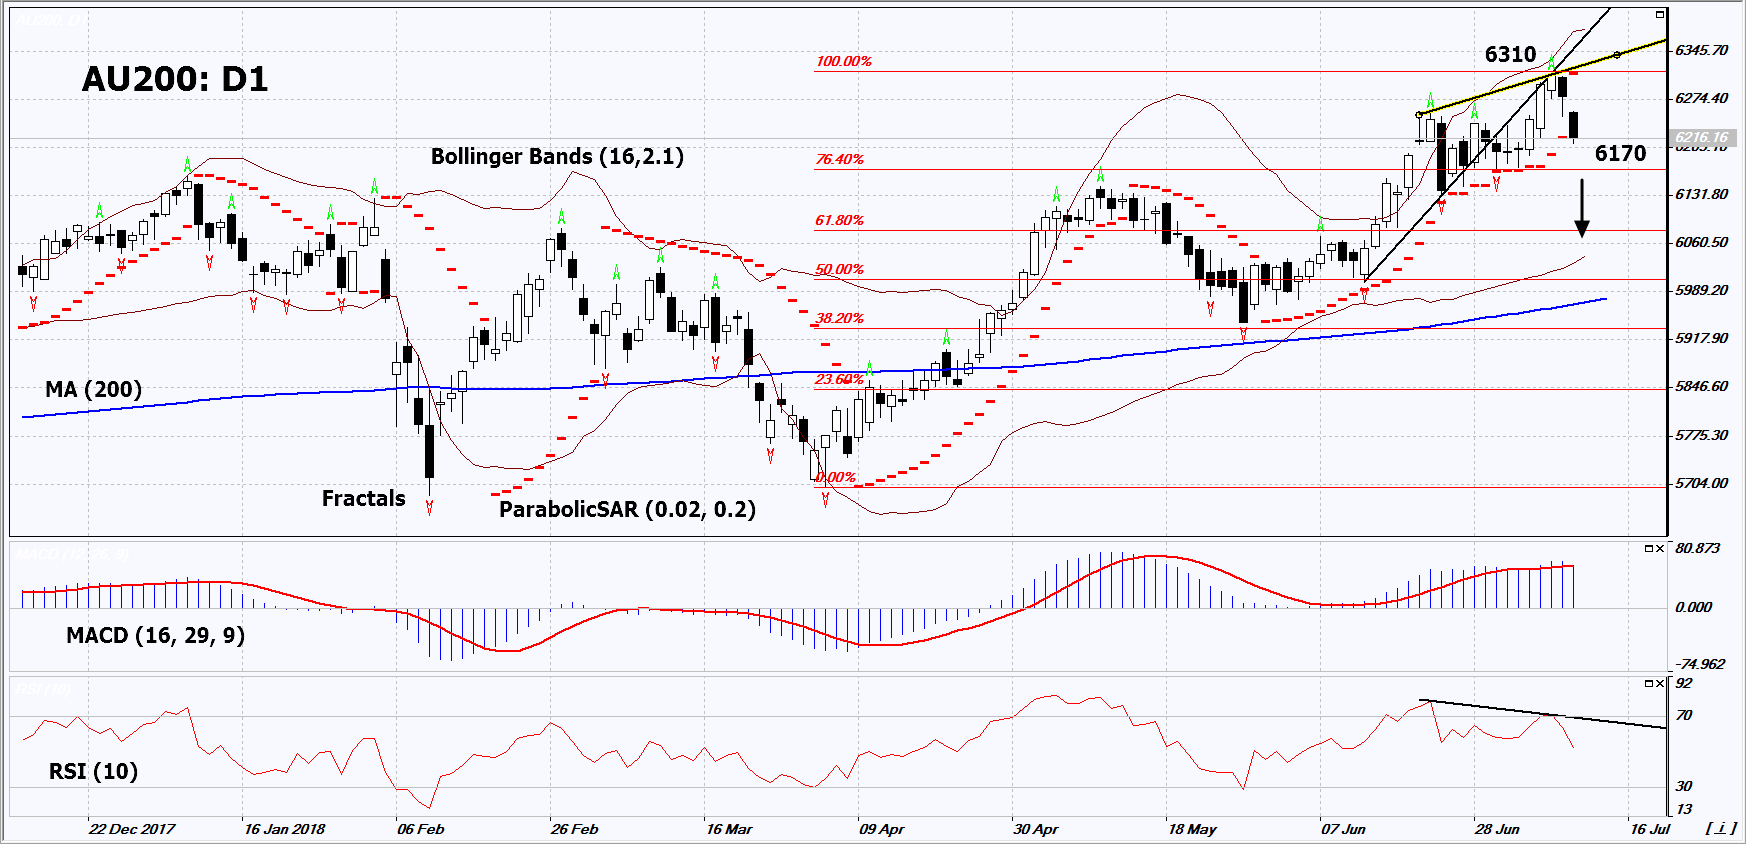
On the daily timeframe, AU200: D1 breached down the support line of the accelerated uptrend. The medium-term uptrend preserves, but the prices are correcting down from the high since December 2007. The decrease in demand for Australian raw materials in China may contribute to their further decline.
- The Parabolic indicator gives a bearish signal.
- The Bollinger bands have widened, which indicates high volatility.
- The RSI indicator is above 50. It has formed a negative divergence.
- The MACD indicator gives bearish signals.
The bearish momentum may develop in case AU200 falls below its last fractal low at 6170. This level may serve as an entry point. The initial stop loss may be placed above the last fractal high, the Parabolic signal and the 10.5-year high at 6310. After opening the pending order, we shall move the stop to the next fractal high following the Bollinger and Parabolic signals. Thus, we are changing the potential profit/loss to the breakeven point. More risk-averse traders may switch to the 4-hour chart after the trade and place there a stop loss moving it in the direction of the trade. If the price meets the stop level (6310) without reaching the order (6170), we recommend to close the position: the market sustains internal changes that were not taken into account.
Summary of technical analysis
| Position | Sell |
| Sell stop | Below 6170 |
| Stop loss | Above 6310 |
- Get Certificate

Note:
This overview has an informative and tutorial character and is published for free. All the data, included in the overview, are received from public sources, recognized as more or less reliable. Moreover, there is no guarantee that the indicated information is full and precise. Overviews are not updated. The whole information in each overview, including opinion, indicators, charts and anything else, is provided only for familiarization purposes and is not financial advice or а recommendation. The whole text and its any part, as well as the charts cannot be considered as an offer to make a deal with any asset. IFC Markets and its employees under any circumstances are not liable for any action taken by someone else during or after reading the overview.
