- Analytics
- Technical Analysis
EUR USD Technical Analysis - EUR USD Trading: 2016-02-22
US economy may overperform European
January inflation came out in US on Friday. It twice exceeded the December reading being 1.4% year on year while the core consumer price index (ex. energy and food) showed the highest growth since August 2011 at 0.3%. Higher inflation in US raises the chances for Fed interest rate hike and pushes up the US dollar and dollar index. In this review we will focus on the euro against US dollar rate. Will the pair continue weakening?
Strong data for dollar came out on Friday after the weak data from EU. The European trade balance surplus for December fell short of expectations on Monday. The February ZEW economic indicators, calculated by the Center for European Economic Research, came out lower on Tuesday in Germany. The drab December construction data came out in Eurozone on Wednesday. All this pushed euro lower. However, the neutral current account balance came out in Eurozone on Thursday which suspended the negative trend. This week the important economic data will come out in Eurozone every day except for Wednesday. The most significant European and US indicators are expected on Friday. The additional political negative factor for euro is the heightened risks of Brexit. Great Britain failed to agree upon the special EU membership conditions so far.
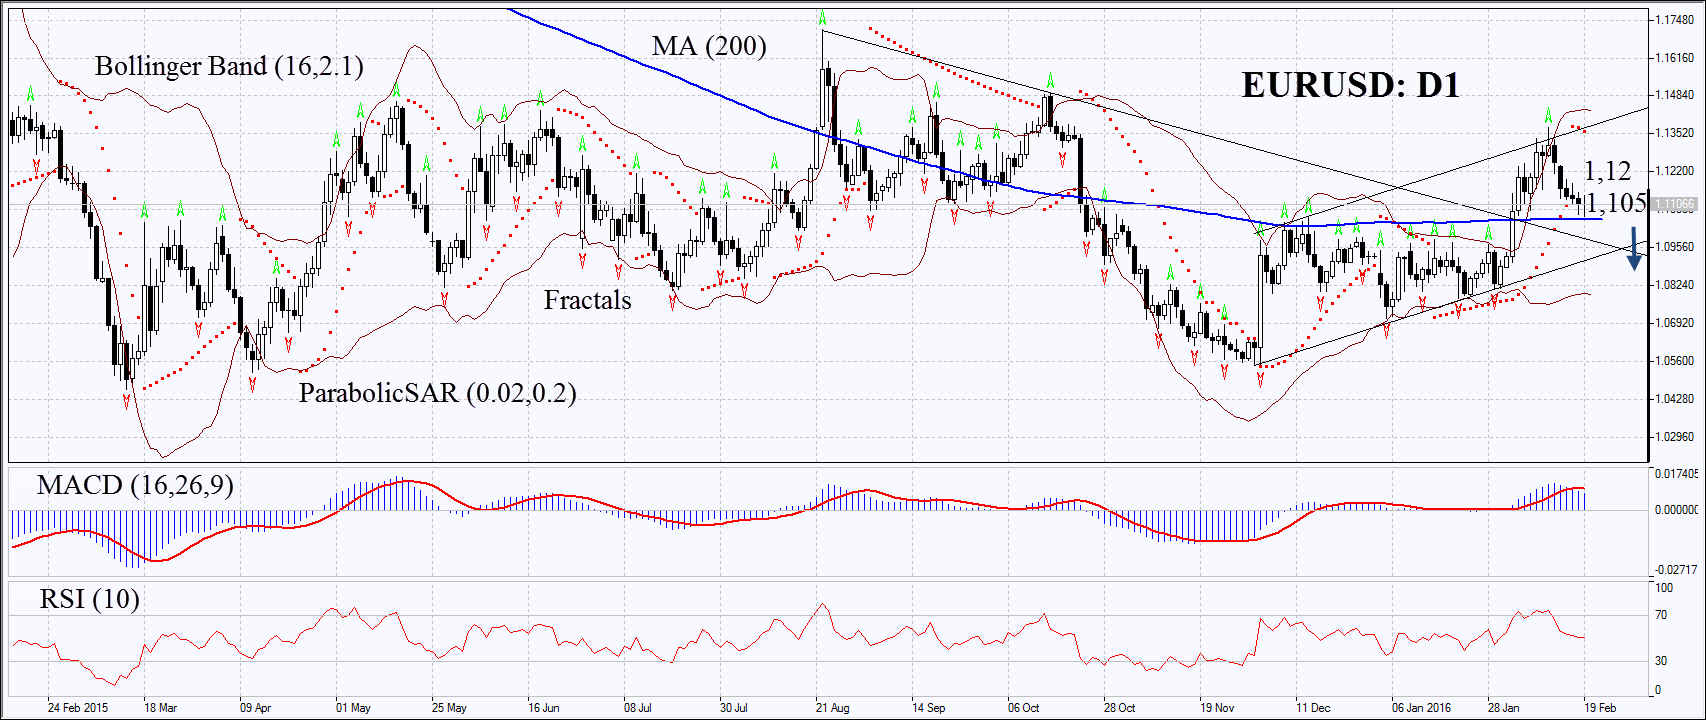
On the daily chart EURUSD: D1 is correcting down within the ascending channel and has verged its 200-day moving average. The Parabolic and MACD indicators have formed sell signals. RSI is falling and has already reached the level of 50, no divergence. The Bollinger bands have widened a lot which may mean higher volatility. The bearish momentum may develop in case euro surpasses the 200-day moving average at 1.105. This level may serve the point of entry. The initial risk-limit may be placed above 1.12. Having opened the pending order we shall move the stop to the next fractal high following the Parabolic and Bollinger signals. Thus, we are changing the probable profit/loss ratio to the breakeven point. The most risk-averse traders may switch to the 4-hour chart after the trade and place there a stop-loss moving it in the direction of the trade. If the price meets the stop-loss level at 1.12 without reaching the order at 1.105, we recommend cancelling the position: the market sustains internal changes which were not taken into account.
| Position | Sell |
| Sell stop | below 1,105 |
| Stop loss | above 1,12 |
- Get Certificate

Note:
This overview has an informative and tutorial character and is published for free. All the data, included in the overview, are received from public sources, recognized as more or less reliable. Moreover, there is no guarantee that the indicated information is full and precise. Overviews are not updated. The whole information in each overview, including opinion, indicators, charts and anything else, is provided only for familiarization purposes and is not financial advice or а recommendation. The whole text and its any part, as well as the charts cannot be considered as an offer to make a deal with any asset. IFC Markets and its employees under any circumstances are not liable for any action taken by someone else during or after reading the overview.
