- Analytics
- Technical Analysis
EUR USD Technical Analysis - EUR USD Trading: 2016-04-19
Getting ready to ECB meeting
On Thursday April 21 at 13:45 СЕТ the following ECB meeting is scheduled. Investors expect no immediate interest rate cuts while assume the further monetary easing is probable. Will the euro edge lower?
Since the start of the year the euro has strengthened around 4% against the US dollar which may have happened on economic data. The Eurozone GDP growth was 1.6% in Q4, above the same indicator in US (+1.4%). Meanwhile, the European trade balance is continuously positive which is far above the constant negative trade balance in US. Nevertheless, the risks of further interest rate cuts by ECB may offset positive economic news and push the euro lower. The 5-year government bonds yield is negative at 0.36% while the yield on the same-term US bonds is 1.23%. Meanwhile, the US government left room open for further interest rate hikes while ECB, on the contrary, is going to cut them. The current overnight rate is 0.37% in US and -0.34% in EU. We believe, the higher risks of rates divergence may weaken the euro.
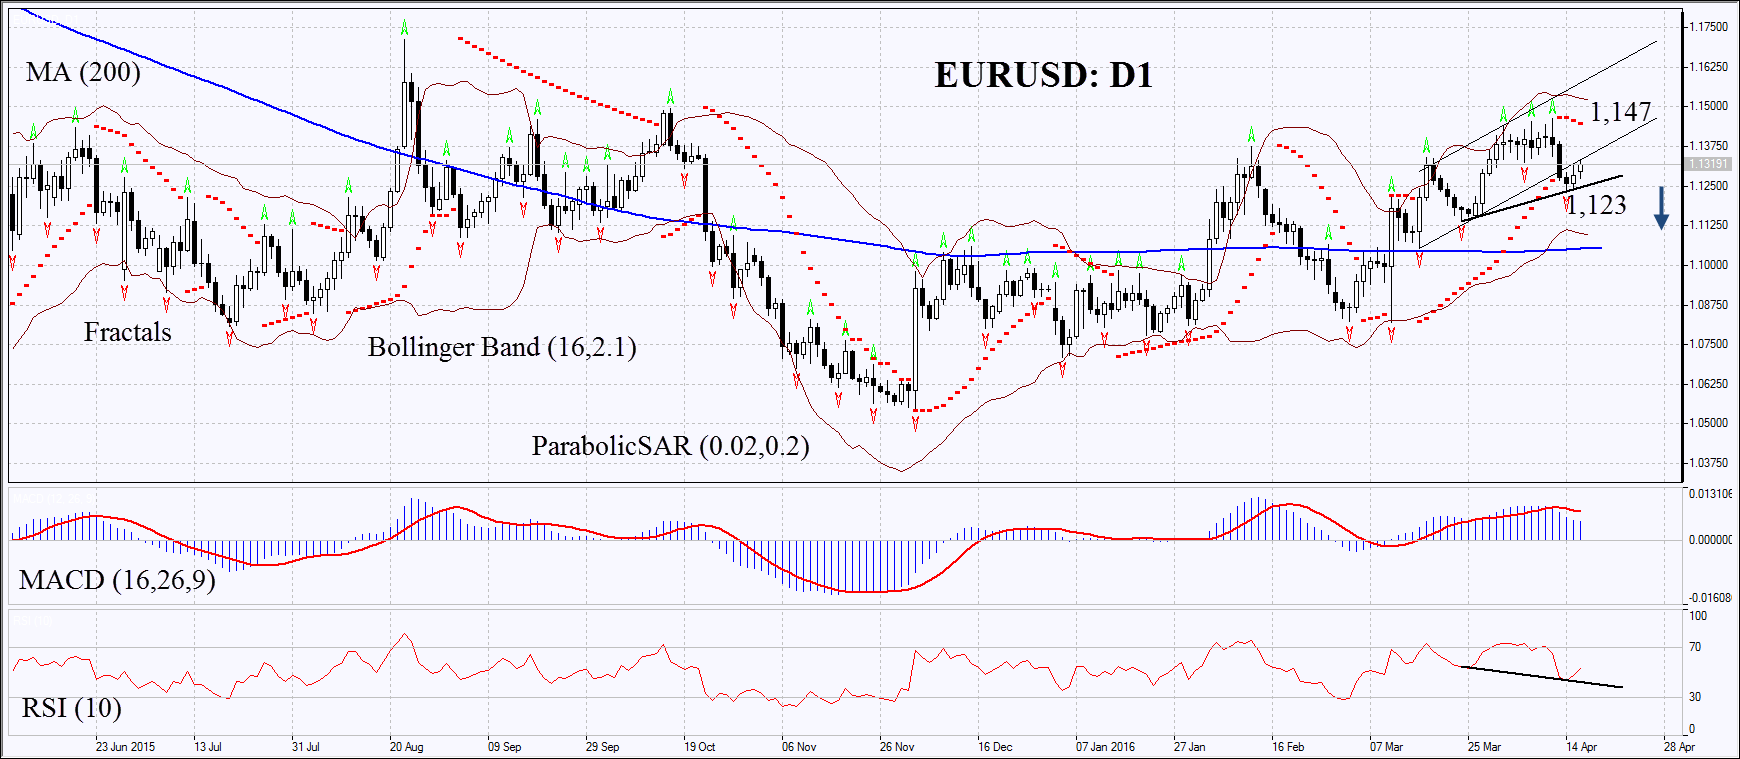
On the daily chart EURUSD: D1 is struggling for getting back in the rising channel after the recent break through its support line. The MACD and Parabolic indicators give bearish signals. The RSI has left the overbought zone and formed the negative divergence. It is above 50 now. The Bollinger bands have widened which means higher volatility and are tilted downwards. The bearish momentum may develop in case the euro falls below the last fractal low at 1.123. This level may serve the point of entry. The initial risk-limit may be placed above the last fractal high at 1.147. Having opened the pending order we shall move the stop to the next fractal high following the Parabolic and Bollinger signals. Thus, we are changing the probable profit/loss ratio to the breakeven point. The most risk-averse traders may switch to the 4-hour chart after the trade and place there a stop-loss moving it in the direction of the trade. If the price meets the stop-loss level at 1.12 without reaching the order at 1.147, we recommend cancelling the position: the market sustains internal changes which were not taken into account.
| Position | Sell |
| Sell stop | below 1.123 |
| Stop loss | above 1.147 |
Explore our
Trading Conditions
- Spreads from 0.0 pip
- 30,000+ Trading Instruments
- Stop Out Level - Only 10%
Ready to Trade?
Open Account Note:
This overview has an informative and tutorial character and is published for free. All the data, included in the overview, are received from public sources, recognized as more or less reliable. Moreover, there is no guarantee that the indicated information is full and precise. Overviews are not updated. The whole information in each overview, including opinion, indicators, charts and anything else, is provided only for familiarization purposes and is not financial advice or а recommendation. The whole text and its any part, as well as the charts cannot be considered as an offer to make a deal with any asset. IFC Markets and its employees under any circumstances are not liable for any action taken by someone else during or after reading the overview.
