- Analytics
- Technical Analysis
GBP USD Technical Analysis - GBP USD Trading: 2017-06-02
Election uncertainty weighs on British Pound
UK economy slowed in the first quarter and uncertainty about June 8 general election persists. Will the British Pound continue weakening?
The decline in British economy’s growth rate in the first quarter was bigger than first estimated. The UK GDP grew 0.2% on quarter in the three months to March of 2017, below the preliminary estimate of 0.3%, according to the Office for National Statistics. The British economy recorded 0.7% growth in Q4 2016. The slower growth resulted from slowing in household spending while business investment rebounded. Recent data were mixed: industrial production fell in March 0.5% following 0.8% contraction in previous month; trade deficit rose to 4.9 billion Pounds from 2.65 billion a month ago; however retail sales rebounded in April to 2.3% after 1.4% decline in March and unemployment rate fell to 4.6% in March from 4.7% in February and Gfk consumer confidence rose to negative 5 in May from negative 8 in previous month. But continued uncertainty whether the Conservative party will win a majority in June 8 general elections is weighing on Pound. A YouGov poll showed May might lose 20 seats leaving the Tories well short of the number of seats needed to form a government. Latest polls showed Conservatives were still in the lead. It is believed a hung parliament will make Brexit negotiations with European Union more difficult, likely leading to hard Brexit scenarios.
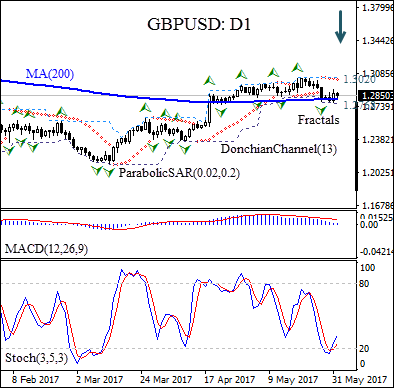
On the daily chart the GBPUSD: D1 is testing the 200-day moving average MA(200).
- The Parabolic indicator gives a sell signal.
- The Donchian channel is tilting lower, indicating a downtrend.
- The MACD indicator is above the signal line and the gap is falling, which is a bearish signal.
- The stochastic oscillator is rising but has not reached the overbought zone.
We believe the bearish movement will continue after the price breaches below the lower Donchian bound at 1.2768. It can be used as an entry point for a pending order to sell. The stop loss can be placed above the Parabolic signal at 1.3020. After placing the pending order the stop loss is to be moved every day to the next fractal high, following Parabolic signals. Thus, we are changing the probable profit/loss ratio to the breakeven point. If the price meets the stop-loss level (1.3020) without reaching the order (1.2768) we recommend cancelling the position: the market sustains internal changes which were not taken into account.
Technical Analysis Summary
| Position | Sell |
| Sell stop | Below 1.2768 |
| Stop loss | Above 1.3020 |
Explore our
Trading Conditions
- Spreads from 0.0 pip
- 30,000+ Trading Instruments
- Stop Out Level - Only 10%
Ready to Trade?
Open Account Note:
This overview has an informative and tutorial character and is published for free. All the data, included in the overview, are received from public sources, recognized as more or less reliable. Moreover, there is no guarantee that the indicated information is full and precise. Overviews are not updated. The whole information in each overview, including opinion, indicators, charts and anything else, is provided only for familiarization purposes and is not financial advice or а recommendation. The whole text and its any part, as well as the charts cannot be considered as an offer to make a deal with any asset. IFC Markets and its employees under any circumstances are not liable for any action taken by someone else during or after reading the overview.
