- Analytics
- Technical Analysis
GBP USD Technical Analysis - GBP USD Trading: 2017-11-02
Positive data support British Pound
Manufacturing activity expanded faster than expected in October. Will the GBPUSD resume strengthening?
UK manufacturing activity expanded in October: Markit’s manufacturing purchasing managers’ index rose to 56.3 in October, from an upwardly revised 56.0 in September. And Nationwide house price index annual growth edged up to a three month high in October despite diminished prospect after Brexit. Against the background of accelerating economy recent positive data raise chances the Bank of England will opt to hike rates today.
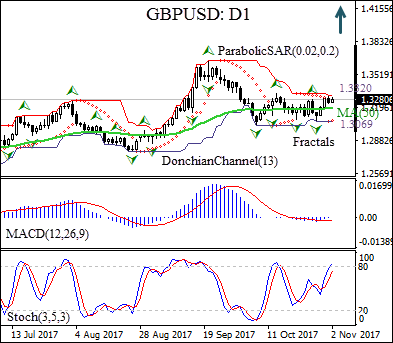
On the daily chart the GBPUSD: D1 has breached above the 50-day moving average MA(50).
- The Parabolic indicator has formed a buy signal.
- The Donchian channel is neutral, it is flat.
- The MACD indicator is below the signal line and the gap is narrowing, which is a bullish signal.
- The stochastic oscillator has breached into the overbought zone, this is a bearish signal.
We believe the bullish movement will continue after the price breaches above the upper Donchian boundary at 1.3320. A price above that level can be used as an entry point for a pending order to buy. The stop loss can be placed below the fractal low at 1.3069. After placing the pending order the stop loss is to be moved every day to the next fractal low, following Parabolic signals. Thus, we are changing the probable profit/loss ratio to the breakeven point. If the price meets the stop-loss level (1.3069) without reaching the order (1.3320) we recommend cancelling the position: the market sustains internal changes which were not taken into account.
Technical Analysis Summary
| Position | Buy |
| Buy stop | Above 1.3320 |
| Stop loss | Below 1.3069 |
Explore our
Trading Conditions
- Spreads from 0.0 pip
- 30,000+ Trading Instruments
- Stop Out Level - Only 10%
Ready to Trade?
Open Account Note:
This overview has an informative and tutorial character and is published for free. All the data, included in the overview, are received from public sources, recognized as more or less reliable. Moreover, there is no guarantee that the indicated information is full and precise. Overviews are not updated. The whole information in each overview, including opinion, indicators, charts and anything else, is provided only for familiarization purposes and is not financial advice or а recommendation. The whole text and its any part, as well as the charts cannot be considered as an offer to make a deal with any asset. IFC Markets and its employees under any circumstances are not liable for any action taken by someone else during or after reading the overview.
