- Analytics
- Technical Analysis
Hang Seng Index Technical Analysis - Hang Seng Index Trading: 2019-04-05
HK50 technical setup remains bullish
Continued contraction in private sector activities followed preceding report of falling retail sales in February. Will the HK50 advance continue?
Hong Kong economic data have been weak recently: retail sales recorded 10.4% decline over year in February following 6.9% growth in January. The Nikkei PMI decline to 48 in March from 48.4 in February indicated the contraction in the private sector continued: above 50.0 indicates sector expansion, and contraction below. Slowing of activities is due to deteriorated US-China trade relations, where a progress in bilateral talks was qualified as “ninety percent of the deal is done, but the last 10% is the hardest part ” by a US Chamber of Commerce executive ahead of Vice Premier Liu’s visit this week to Washington to continue negotiations. However technical indicators point to upside momentum for Hong Kong stock market. The unresolved US-China trade dispute remains a downside risk for Hong Kong stock market.
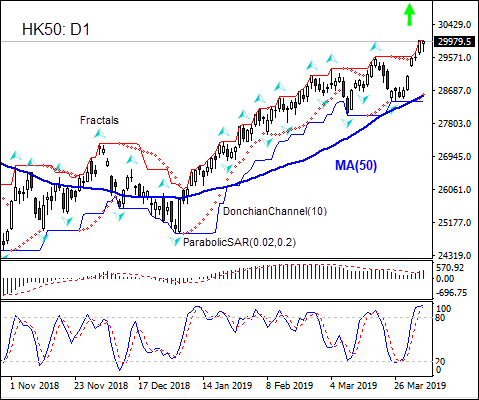
On the daily timeframe HK50: D1 is rising remaining above the 50-day moving average MA(50), which is rising too. These are bullish developments.
- The Parabolic indicator has formed a buy signal.
- The Donchian channel indicates no trend yet: it is flat.
- The MACD indicator is above the signal line with the gap widening. This is a bullish signal.
- The Stochastic oscillator is in the overbought zone, this is bearish.
We believe the bullish momentum will continue after the price breaches above the upper Donchian boundary at 30010.0. This level can be used as an entry point for placing a pending order to buy. The stop loss can be placed below the lower fractal at 28400.5. After placing the pending order the stop loss is to be moved every day to the next fractal low, following Parabolic signals. Thus, we are changing the expected profit/loss ratio to the breakeven point. If the price meets the stop-loss level (28400.5) without reaching the order (30010.0) we recommend cancelling the order: the market sustains internal changes which were not taken into account.
Technical Analysis Summary
| Position | Buy |
| Buy Stop | Above 30010.0 |
| Stop loss | Below 28400.5 |
Explore our
Trading Conditions
- Spreads from 0.0 pip
- 30,000+ Trading Instruments
- Stop Out Level - Only 10%
Ready to Trade?
Open Account Note:
This overview has an informative and tutorial character and is published for free. All the data, included in the overview, are received from public sources, recognized as more or less reliable. Moreover, there is no guarantee that the indicated information is full and precise. Overviews are not updated. The whole information in each overview, including opinion, indicators, charts and anything else, is provided only for familiarization purposes and is not financial advice or а recommendation. The whole text and its any part, as well as the charts cannot be considered as an offer to make a deal with any asset. IFC Markets and its employees under any circumstances are not liable for any action taken by someone else during or after reading the overview.
