- Análisis
- Análisis Técnico
USD/CHF Análisis Técnico - USD/CHF Trading: 2022-06-30
USD/CHF Resumen de análisis técnico
Por debajo de 0.9529
Sell Stop
Por encima de 0.9603
Stop Loss
| Indicador | Señal |
| RSI | Vender |
| MACD | Comprar |
| MA(200) | Vender |
| Fractals | Neutral |
| Parabolic SAR | Comprar |
USD/CHF Análisis gráfico
USD/CHF Análisis técnico
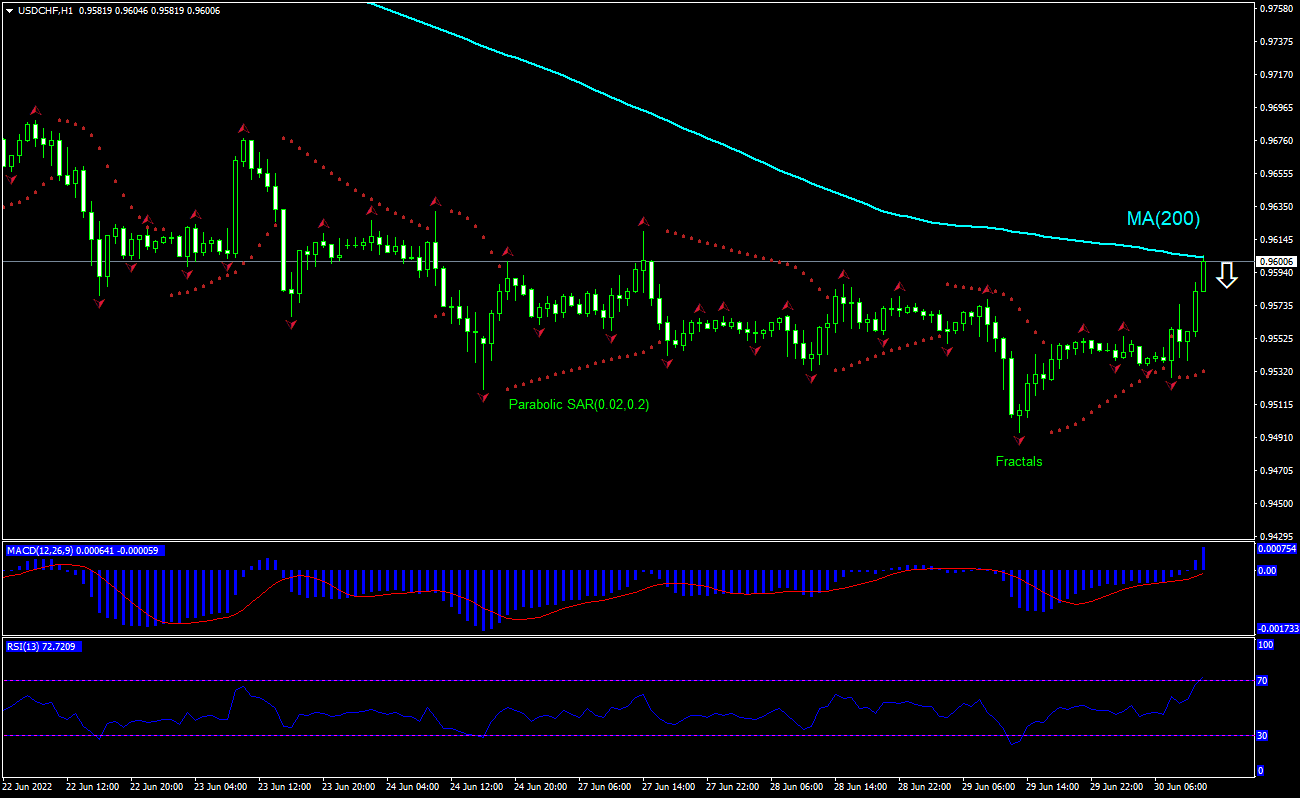
The USDCHF technical analysis of the price chart on hourly timeframe shows USDCHF,H1 is rebounding toward the 200-period moving average MA(200) which is falling still. The RSI has entered the overbought zone. We believe the bearish momentum will resume after the price breaches below 0.9529. A level below this can be used as an entry point for placing a pending order to sell. The stop loss can be placed above 0.9603. After placing the order, the stop loss is to be moved to the next fractal high, following Parabolic signals. Thus, we are changing the expected profit/loss ratio to the breakeven point. If the price meets the stop loss level without reaching the order, we recommend cancelling the order: the market has undergone internal changes which were not taken into account.
Análisis fundamental de Forex - USD/CHF
Swiss retail sales declined less than forecast in May. Will the USDCHF price rebound reverse?
Swiss retail sales declined less than forecast in May. The Swiss Federal Statistical Office reported retail trade turnover in Switzerland decreased 1.6% over year in May after 5.5% drop in April, when a 5.0% decrease was expected. This is bearish for USDCHF.
Explore nuestras
Condiciones de Trading
- Spreads desde 0.0 pip
- 30,000+ Instrumentos de Trading
- Ejecución Instantánea
¿Listo para Operar?
Abrir Cuenta Nota:
Este resumen tiene carácter informativo-educativo y se publica de forma gratuita. Todos los datos que contiene este resumen, son obtenidos de fuentes públicas que se consideran más o menos fiables. Además, no hay niguna garantía de que la información sea completa y exacta. En el futuro, los resúmenes no se actualizarán. Toda la información en cada resumen, incluyendo las opiniones, indicadores, gráficos y todo lo demás, se proporciona sólo para la observación y no se considera como un consejo o una recomendación financiera. Todo el texto y cualquier parte suya, así como los gráficos no pueden considerarse como una oferta para realizar alguna transacción con cualquier activo. La compañía IFC Markets y sus empleados en cualquier circunstancia no son responsables de ninguna acción tomada por otra persona durante o después de la observación del resumen.

