- Analyses
- Analyse technique
Ethereum / USD Analyse technique - Ethereum / USD Trading: 2025-05-26
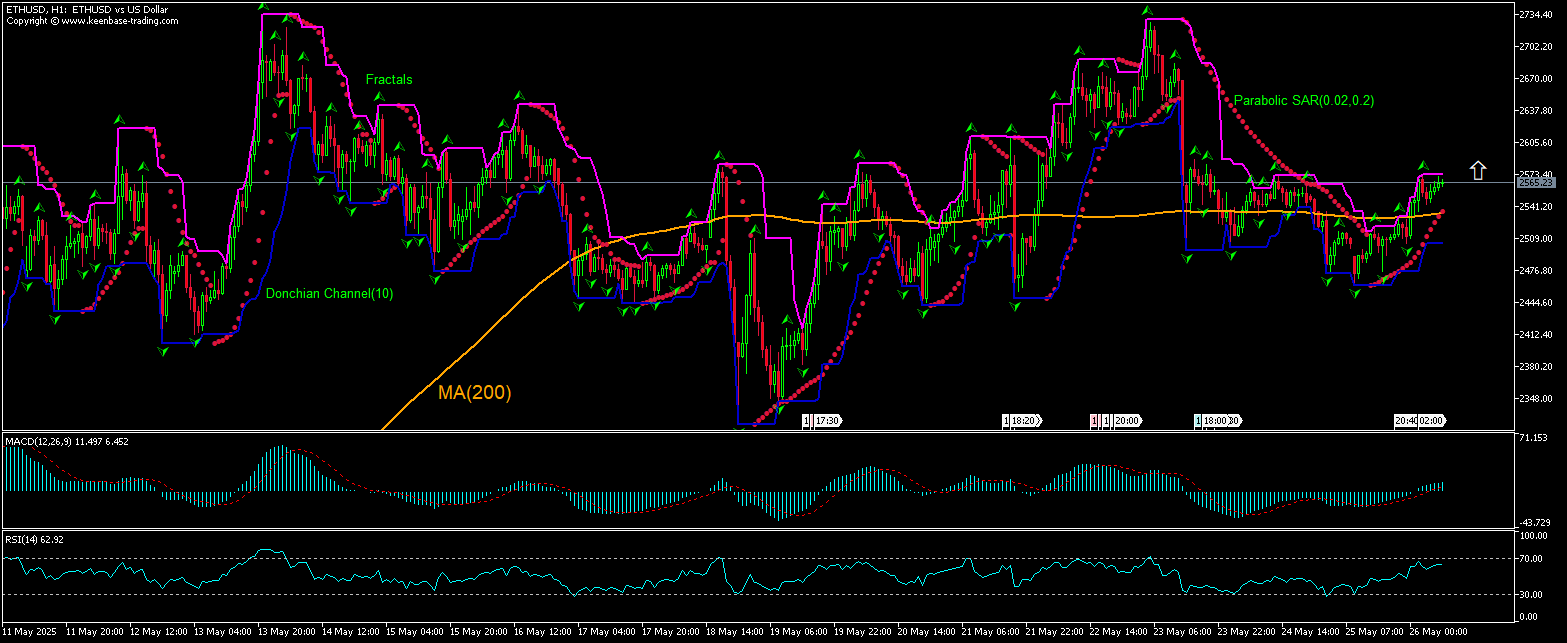
Ethereum / USD Résumé de l'Analyse Technique
Supérieur de 2572.90
Buy Stop
Inférieur à 2533.63
Stop Loss
| indicateur | Signal |
| RSI | Neutre |
| MACD | Acheter |
| Donchian Channel | Neutre |
| MA(200) | Acheter |
| Fractals | Acheter |
| Parabolic SAR | Acheter |
Ethereum / USD Analyse graphique
Ethereum / USD Analyse technique
The ETHUSD technical analysis of the price chart on 1-hour timeframe shows ETHUSD: H1 is rising after breaching above the 200-period moving average MA(200) as it rebounded after a drop to five-day low yesterday. We believe the bullish momentum will continue after the price breaches above the upper bound of the Donchian channel at 2572.90. A level above this can be used as an entry point for placing a pending order to buy. The stop loss can be placed below 2533.63. After placing the order, the stop loss is to be moved to the next fractal low indicator, following Parabolic signals. Thus, we are changing the expected profit/loss ratio to the breakeven point. If the price meets the stop loss level without reaching the order, we recommend cancelling the order: the market has undergone internal changes which were not taken into account.
Analyse Fondamentale de Crypto - Ethereum / USD
Ethereum prices rose as Bitcoin broke into new record territory last week. Will the ETHUSD price continue advancing?
Ethereum rose more than 40% in the last month and prices tracked Bitcoin movement as the cryptocurrency leader broke into new record territory last week. ETHUSD then retreated, unable to breach above $2734. Glassnode post on May 25 notes there is a significant cluster of investor cost basis levels around $2,800, meaning that many holders had bought at that level and were underwater for months as prices retreated from that level. And as ETHUSD approaches this level, they may see it as a chance to exit at break-even which could add significant sell-side pressure to the market. However, the current setup is bullish for ETHUSD.
Explorez nos
conditions de trading
- Spreads à partir de 0.0 pip
- Plus de 30,000 instruments de trading
- Instant Execution
Prêt à trader?
Ouvrir un compte NB:
Cet aperçu a un caractère instructif et didactique, publié gratuitement. Toutes les données, comprises dans l'aperçu, sont reçues de sources publiques, reconnues comme plus ou moins fiables. En outre, rien ne garantit que les informations indiquées sont complètes et précises. Les aperçus ne sont pas mis à jour. L'ensemble de l'information contenue dans chaque aperçu, y compris l'opinion, les indicateurs, les graphiques et tout le reste, est fourni uniquement à des fins de familiarisation et n'est pas un conseil financier ou une recommandation. Tout le texte entier et sa partie, ainsi que les graphiques ne peuvent pas être considérés comme une offre de faire une transaction sur chaque actif. IFC Markets et ses employés, dans n'importe quelle circonstance, ne sont pas responsables de toute action prise par quelqu'un d'autre pendant ou après la lecture de l’aperçu.

