- Analyses
- Analyse technique
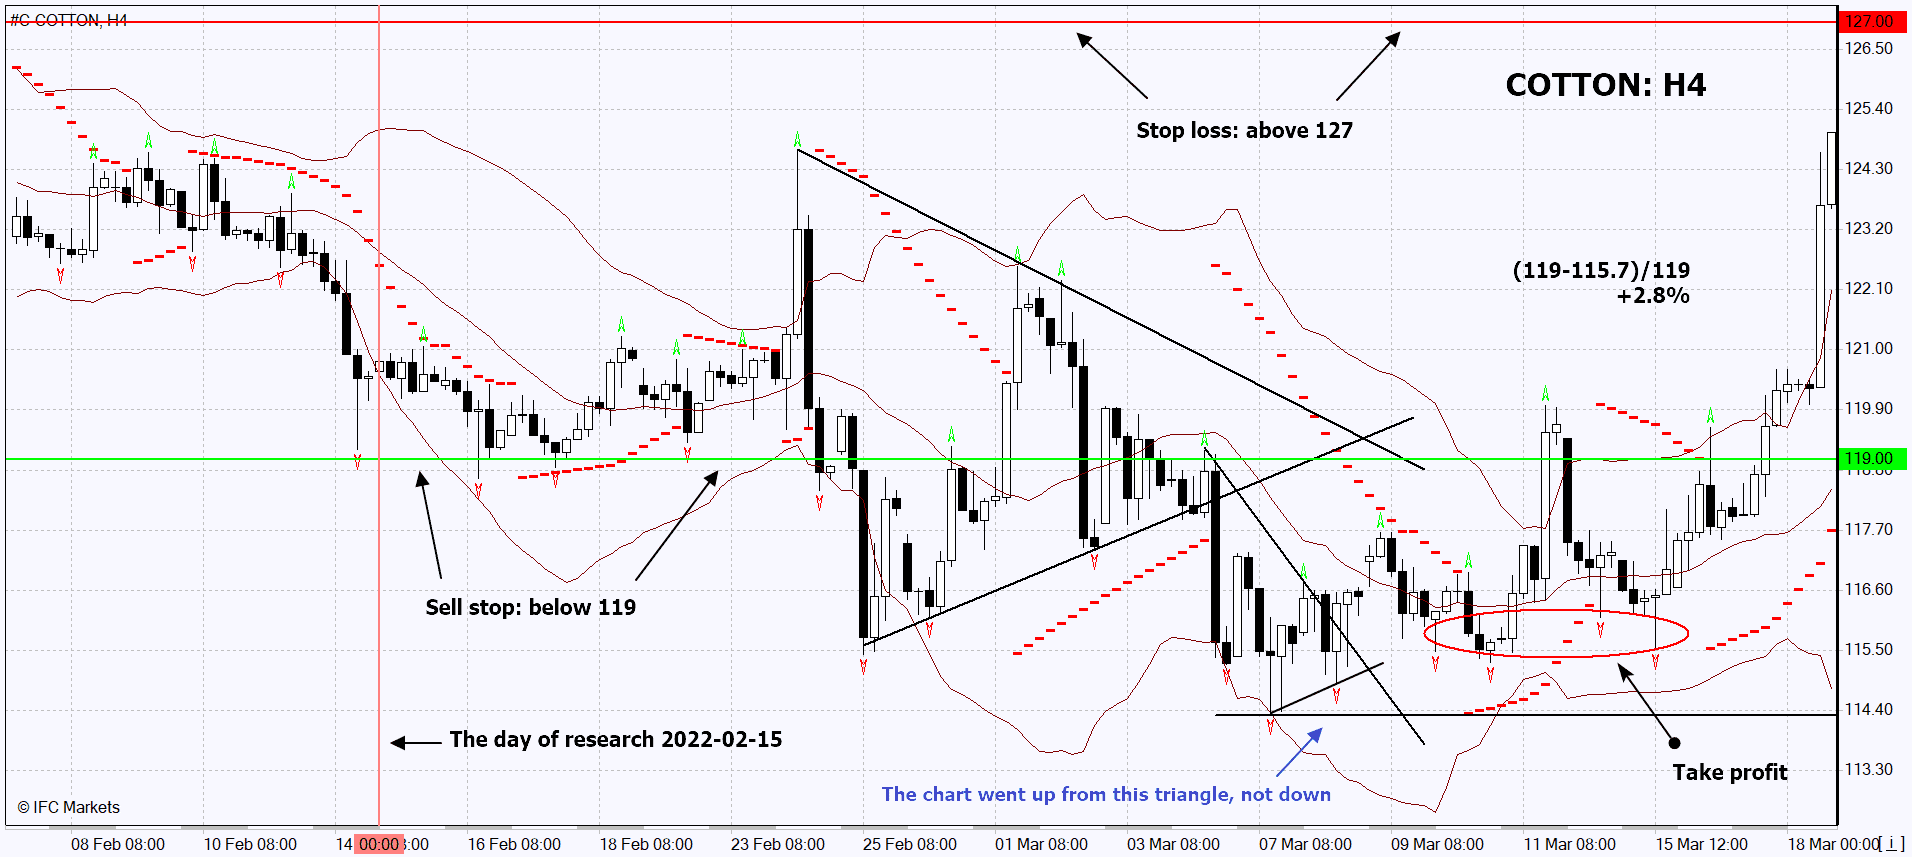
Rétrospective de l'Analyse Technique #C-COTTON à partir de 2022-02-15
La production de coton aux États-Unis a augmenté

| Sell stop | 119 |
| Take profit | 115.7 |
| Return on Investment | +2.8% |
| Overview date | 2022-02-15 |
| Date of the closing position | from 2022-03-10 to 2022-03-15 |
Le graphique montre le véritable changement des cotations après la publication de l'analyse technique le 2022-02-15. L'ordre Pending (en attente) par cette analyse a été exécuté et la position a été ouverte. Ensuite, nous allons passer l'arrêt (stop) au prochain faible fractale en suivant les signaux de Bandes de Bollinger et Paraboliques SAR aux graphiques à 4 heures. Ainsi, nous modifions les Profits / Pertes potentiels au point de rentabilité. La position doit être fermée lorsque le prix correspond aux Bandes de Bollinger, aux SAR Paraboliques, à la ligne de tendance et à l'indicateur fractal.

Nouvel outil analytique exclusif
N'imorte quelle gamme de dates - de 1 jour à 1 an
N'importe quel groupe de trading - Forex, actions, indices etc.
