- Analyses
- Analyse technique
Argent vs Yen Analyse technique - Argent vs Yen Trading: 2018-04-04
Let us consider a new personal composite instrument
In this review, we suggest considering the personal composite instrument (PCI) XAGJPY – Silver vs the Japanese Yen. As its name suggests, it reflects the price dynamics of silver vs the yen. Will the XAGJPY prices rise?
Their growth indicates an increase in silver prices and a weakening of the Japanese yen. Precious metals prices may rise amid global risks because of the US-China trade war. Silver has lagged behind the gold since early 2018. In turn, the weakening of the yen may be caused by the preservation of the super-loose monetary policy of the Bank of Japan. This is contributed by the low inflation in the country. On Friday, April 6, 2018, data on the labor market for March will come out in the US. They can affect the world currency market and, in particular, the exchange rate of the yen. In Japan, the most significant statistics are expected on Monday, April 9, when the current account balance for February will be released. Less important Japanese economic data will be published this week.
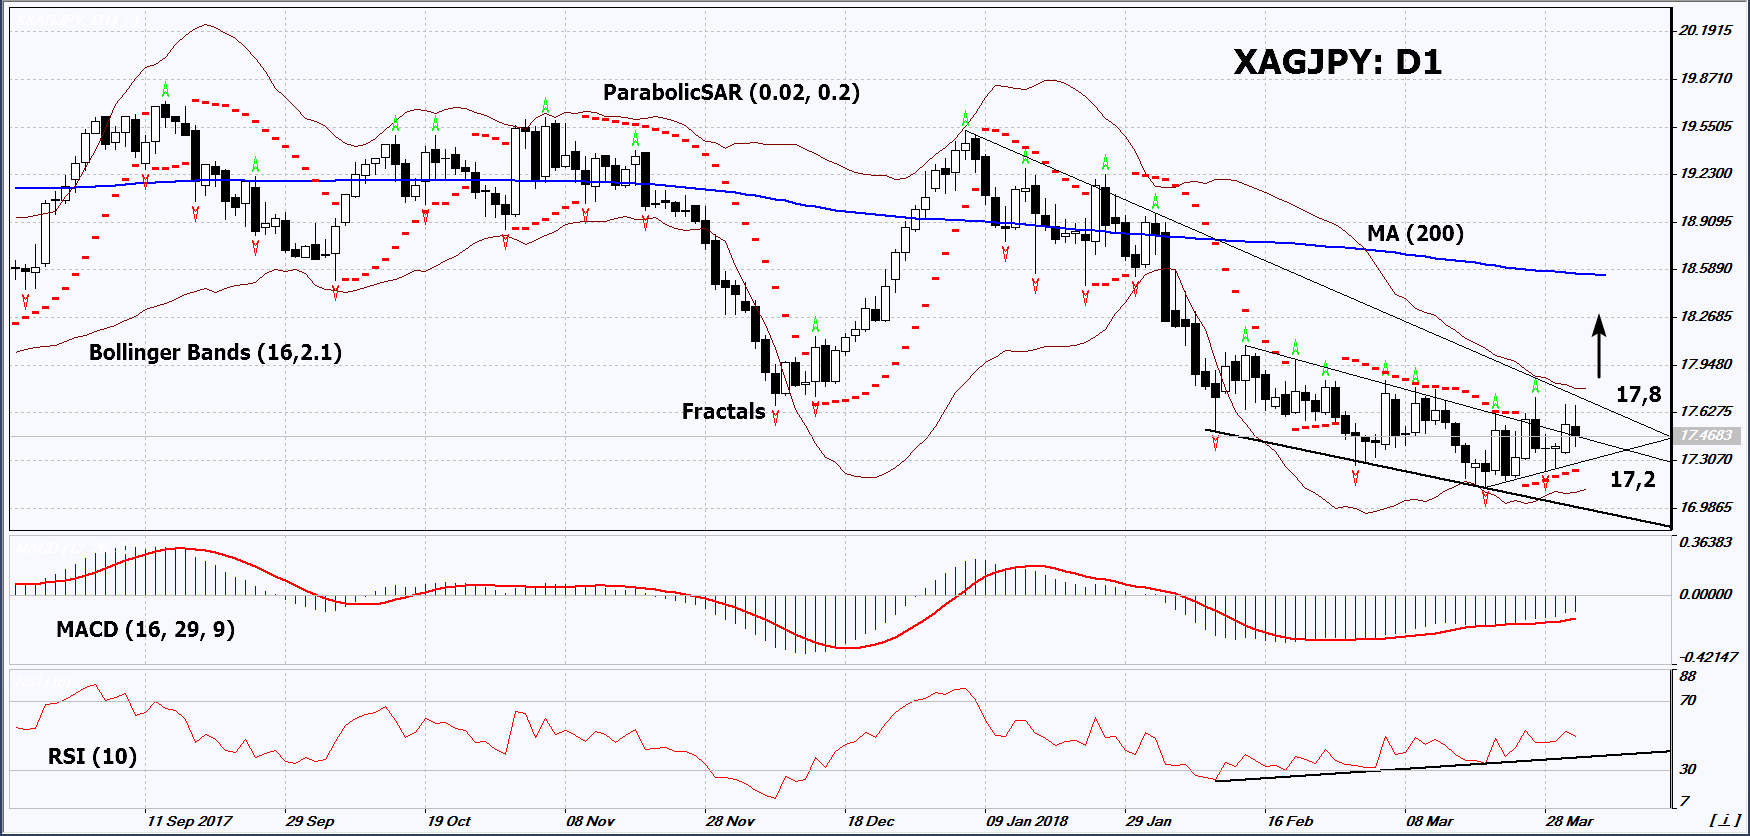
On the daily timeframe, XAGJPY: D1 is trying to edge up from the downtrend. The further price increase is possible in case of increasing global political risks and economic uncertainty, as well as in case of the publication of negative economic data in Japan.
- The Parabolic indicator gives a bullish signal.
- The Bollinger bands have narrowed, which indicates low volatility. They are titled upward.
- The RSI indicator is near 50. It has formed a positive divergence.
- The MACD indicator gives a bullish signal.
The bullish momentum may develop in case XAGJPY exceeds the last fractal high and the Bollinger band at 17.8. This level may serve as an entry point. The initial stop loss may be placed below the last fractal low and the Parabolic signal at 17.2. After opening the pending order, we shall move the stop to the next fractal low following the Bollinger and Parabolic signals. Thus, we are changing the potential profit/loss to the breakeven point. More risk-averse traders may switch to the 4-hour chart after the trade and place there a stop loss moving it in the direction of the trade. If the price meets the stop level at 17.2 without reaching the order at 17.8 we recommend to close the position: the market sustains internal changes that were not taken into account.
Summary of technical analysis
| Position | Buy |
| Buy stop | Above 17,8 |
| Stop loss | Below 17,2 |
- Obtenir un certificat

NB:
Cet aperçu a un caractère instructif et didactique, publié gratuitement. Toutes les données, comprises dans l'aperçu, sont reçues de sources publiques, reconnues comme plus ou moins fiables. En outre, rien ne garantit que les informations indiquées sont complètes et précises. Les aperçus ne sont pas mis à jour. L'ensemble de l'information contenue dans chaque aperçu, y compris l'opinion, les indicateurs, les graphiques et tout le reste, est fourni uniquement à des fins de familiarisation et n'est pas un conseil financier ou une recommandation. Tout le texte entier et sa partie, ainsi que les graphiques ne peuvent pas être considérés comme une offre de faire une transaction sur chaque actif. IFC Markets et ses employés, dans n'importe quelle circonstance, ne sont pas responsables de toute action prise par quelqu'un d'autre pendant ou après la lecture de l’aperçu.
