- Analytics
- Technical Analysis
Silver vs Yen Technical Analysis - Silver vs Yen Trading: 2018-04-04
Let us consider a new personal composite instrument
In this review, we suggest considering the personal composite instrument (PCI) XAGJPY – Silver vs the Japanese Yen. As its name suggests, it reflects the price dynamics of silver vs the yen. Will the XAGJPY prices rise?
Their growth indicates an increase in silver prices and a weakening of the Japanese yen. Precious metals prices may rise amid global risks because of the US-China trade war. Silver has lagged behind the gold since early 2018. In turn, the weakening of the yen may be caused by the preservation of the super-loose monetary policy of the Bank of Japan. This is contributed by the low inflation in the country. On Friday, April 6, 2018, data on the labor market for March will come out in the US. They can affect the world currency market and, in particular, the exchange rate of the yen. In Japan, the most significant statistics are expected on Monday, April 9, when the current account balance for February will be released. Less important Japanese economic data will be published this week.
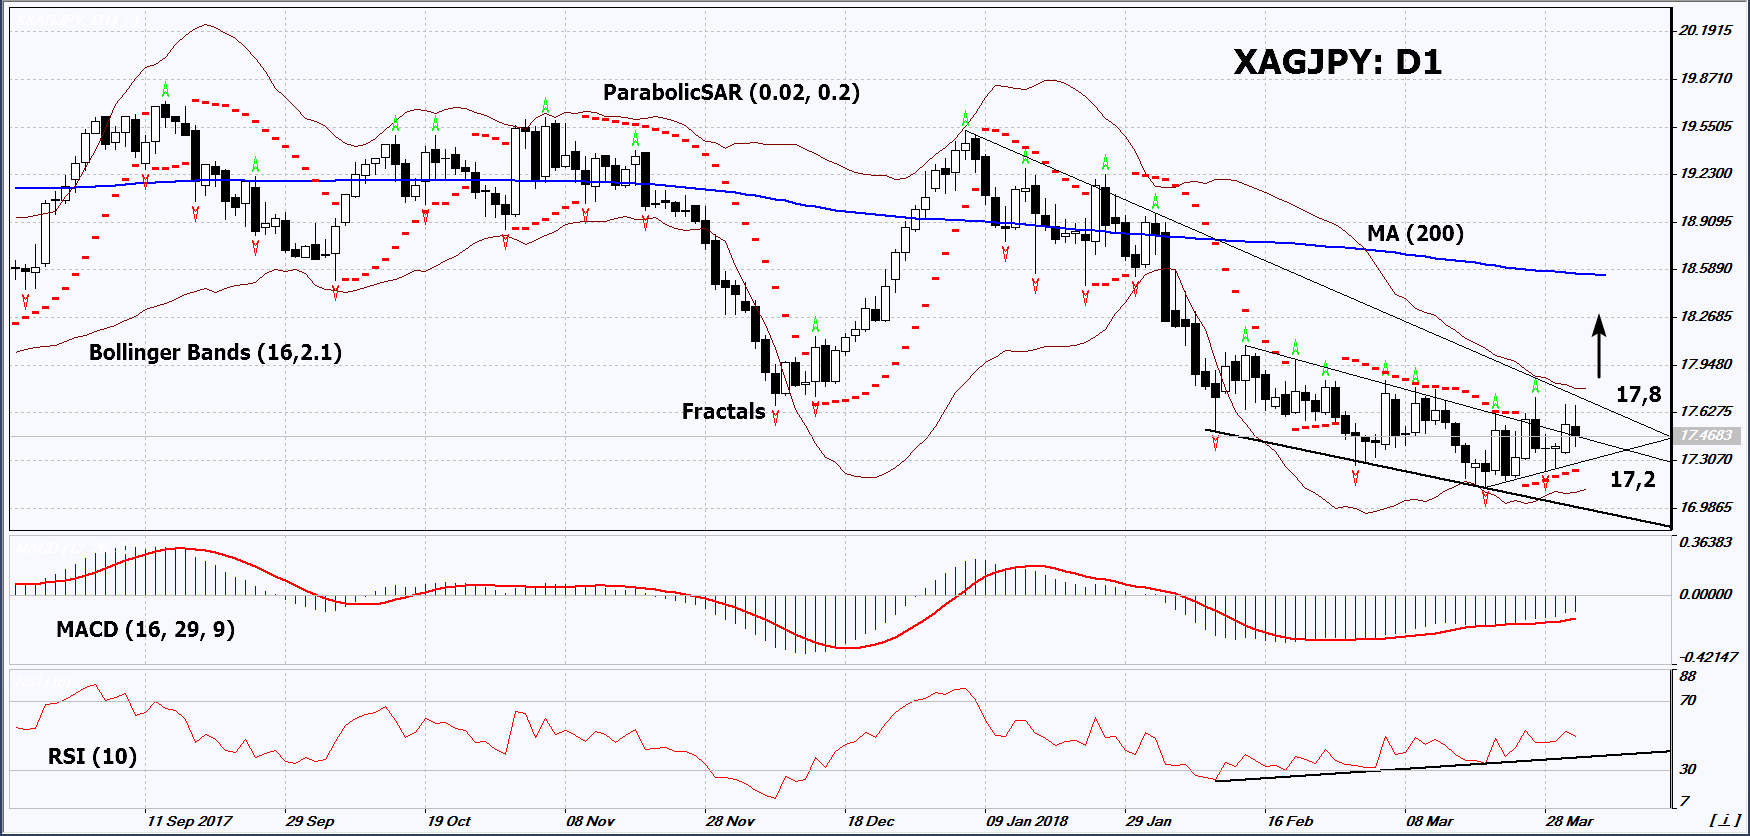
On the daily timeframe, XAGJPY: D1 is trying to edge up from the downtrend. The further price increase is possible in case of increasing global political risks and economic uncertainty, as well as in case of the publication of negative economic data in Japan.
- The Parabolic indicator gives a bullish signal.
- The Bollinger bands have narrowed, which indicates low volatility. They are titled upward.
- The RSI indicator is near 50. It has formed a positive divergence.
- The MACD indicator gives a bullish signal.
The bullish momentum may develop in case XAGJPY exceeds the last fractal high and the Bollinger band at 17.8. This level may serve as an entry point. The initial stop loss may be placed below the last fractal low and the Parabolic signal at 17.2. After opening the pending order, we shall move the stop to the next fractal low following the Bollinger and Parabolic signals. Thus, we are changing the potential profit/loss to the breakeven point. More risk-averse traders may switch to the 4-hour chart after the trade and place there a stop loss moving it in the direction of the trade. If the price meets the stop level at 17.2 without reaching the order at 17.8 we recommend to close the position: the market sustains internal changes that were not taken into account.
Summary of technical analysis
| Position | Buy |
| Buy stop | Above 17,8 |
| Stop loss | Below 17,2 |
Explore our
Trading Conditions
- Spreads from 0.0 pip
- 30,000+ Trading Instruments
- Stop Out Level - Only 10%
Ready to Trade?
Open Account Note:
This overview has an informative and tutorial character and is published for free. All the data, included in the overview, are received from public sources, recognized as more or less reliable. Moreover, there is no guarantee that the indicated information is full and precise. Overviews are not updated. The whole information in each overview, including opinion, indicators, charts and anything else, is provided only for familiarization purposes and is not financial advice or а recommendation. The whole text and its any part, as well as the charts cannot be considered as an offer to make a deal with any asset. IFC Markets and its employees under any circumstances are not liable for any action taken by someone else during or after reading the overview.
