- Analyses
- Top Gagnants / Perdants
Top Gainers and Losers: Japanese Yen and South African Rand
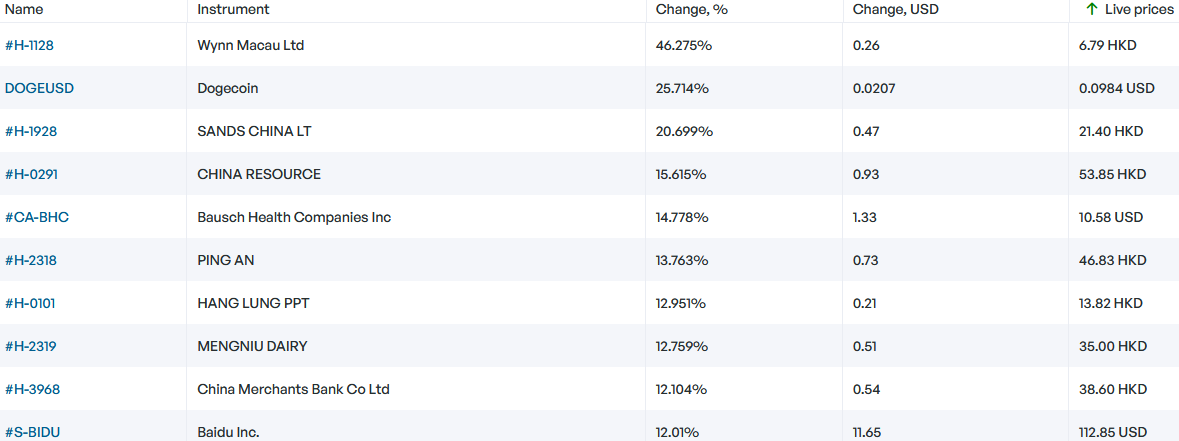
Top Gainers - global market
Over the past 7 days, the US dollar index continued to decline and updated a 5-month low. Based on US statistics, market participants expect a slowdown in the Fed rate growth. According to CME FedWatch, at the next Fed meeting on December 14, it will be increased by only 0.5% to 4.5% with a probability of about 80%. Earlier, the US regulator raised the rate by 0.75% 4 times in a row. The 10-Year US Treasury yield hit a new 9-week low of 3.5% on Friday. The weakening of the South African rand came amid risks of impeachment of South African President Cyril Ramaphosa. The Canadian dollar fell against the backdrop of falling oil and gas prices. In addition, investors expect the Bank of Canada rate to increase by only 0.25% to 4% at the meeting on December 7 from the current level of 3.75%. The Japanese yen continued to strengthen from its 30-year low, which looks like a USDJPY high. Earlier, the Bank of Japan (-0.1%) said it would not allow the yen to weaken too much. Recall that the meeting will be held on December 20.
1. DOGEUSD, +25.7% – Dogecoin cryptocurrency (DOGE)
2. Wynn Macau, Limited, +46.3% – casino and hotel management company in Macau
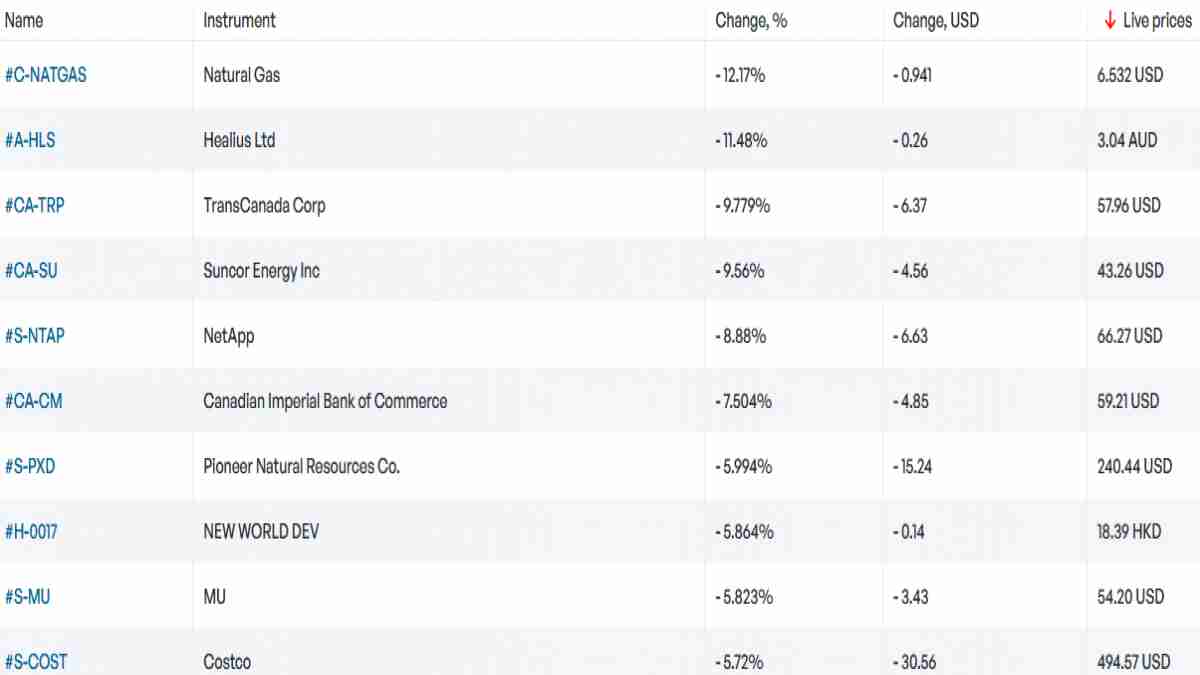
Top Losers - global market
1. Henry Hub Natural Gas Futures CFD – US natural gas
2. Healius Ltd. – Australian health insurance company.
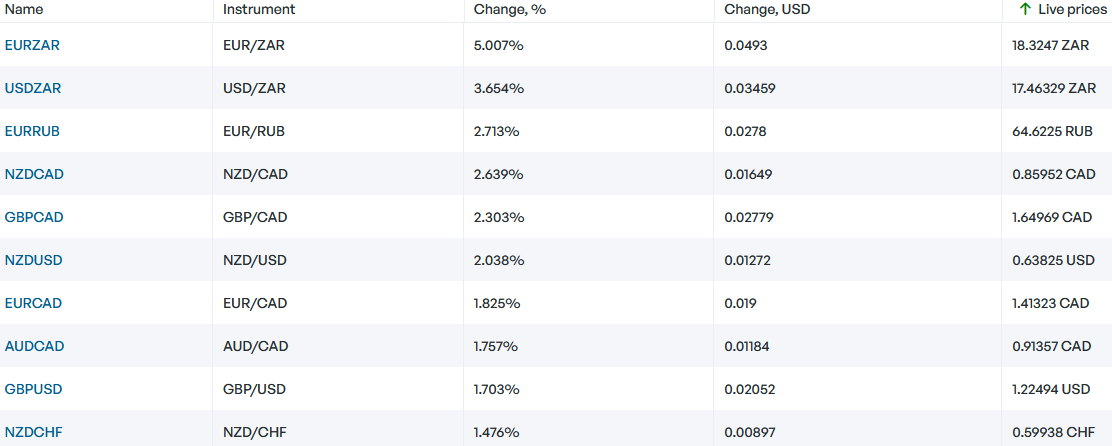
Top Gainers - foreign exchange market (Forex)
1. EURZAR, USDZAR - the growth of these graphs means the strengthening of the euro and the US dollar against the South African rand.
2. NZDCAD, GBPCAD - the growth of these graphs means the weakening of the Canadian dollar against the New Zealand dollar and the British pound.
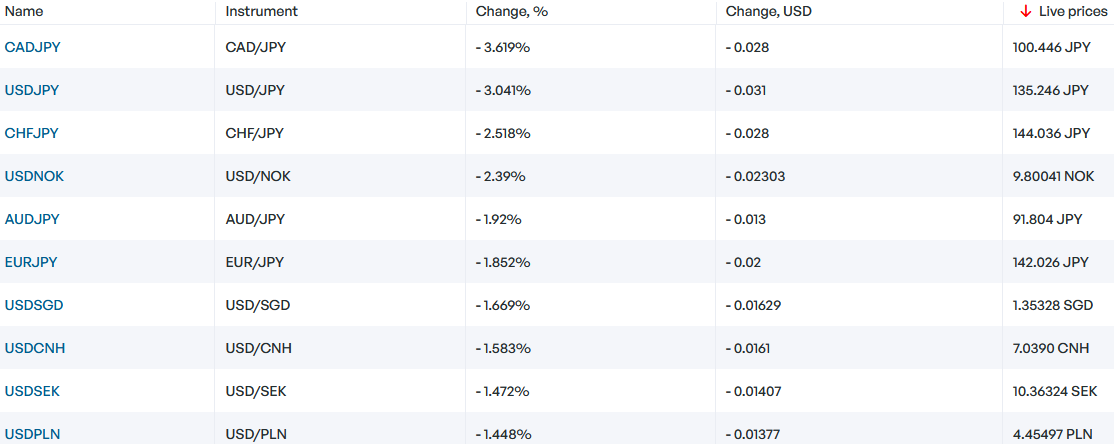
Top Losers - foreign exchange market (Forex)
1. CADJPY, CHFJPY - the decline of these graphs means the weakening of the Canadian dollar and the Swiss franc against the Japanese yen.
2. USDJPY, USDNOK - the decline in these graphs means the strengthening of the Japanese yen and the Norwegian krone against the US dollar.
Nouvel outil analytique exclusif
N'imorte quelle gamme de dates - de 1 jour à 1 an
N'importe quel groupe de trading - Forex, actions, indices etc.
NB:
Cet aperçu a un caractère instructif et didactique, publié gratuitement. Toutes les données, comprises dans l'aperçu, sont reçues de sources publiques, reconnues comme plus ou moins fiables. En outre, rien ne garantit que les informations indiquées sont complètes et précises. Les aperçus ne sont pas mis à jour. L'ensemble de l'information contenue dans chaque aperçu, y compris l'opinion, les indicateurs, les graphiques et tout le reste, est fourni uniquement à des fins de familiarisation et n'est pas un conseil financier ou une recommandation. Tout le texte entier et sa partie, ainsi que les graphiques ne peuvent pas être considérés comme une offre de faire une transaction sur chaque actif. IFC Markets et ses employés, dans n'importe quelle circonstance, ne sont pas responsables de toute action prise par quelqu'un d'autre pendant ou après la lecture de l’aperçu.
- Obtenir un certificat


Précédent Top Gagnants & Perdants
Over the past 7 days, the American dollar has remained almost unchanged. According to the CME FedWatch tool, there is an 89% probability of the U.S. Federal Reserve raising interest rates at the meeting on July 26th. The Swiss franc has strengthened due to positive economic indicators such as Credit...
Au cours des 7 derniers jours, l'indice du dollar américain a chuté. Comme prévu, la Fed a maintenu le taux à 5,25 % lors de la réunion du 14 juin. Maintenant, les investisseurs regardent les statistiques économiques et tentent de prédire le changement de taux de la Fed lors de la prochaine réunion...
Au cours des 7 derniers jours, l'indice du dollar américain n'a pas beaucoup changé. Il s'est négocié dans une fourchette étroite de 103,2 à 104,4 points pour la 4e semaine. Les investisseurs attendent le résultat de la réunion de la Fed du 14 juin. Les actions de Tesla ont augmenté avec l'ouverture...