- Analisi
- Dati di Mercato
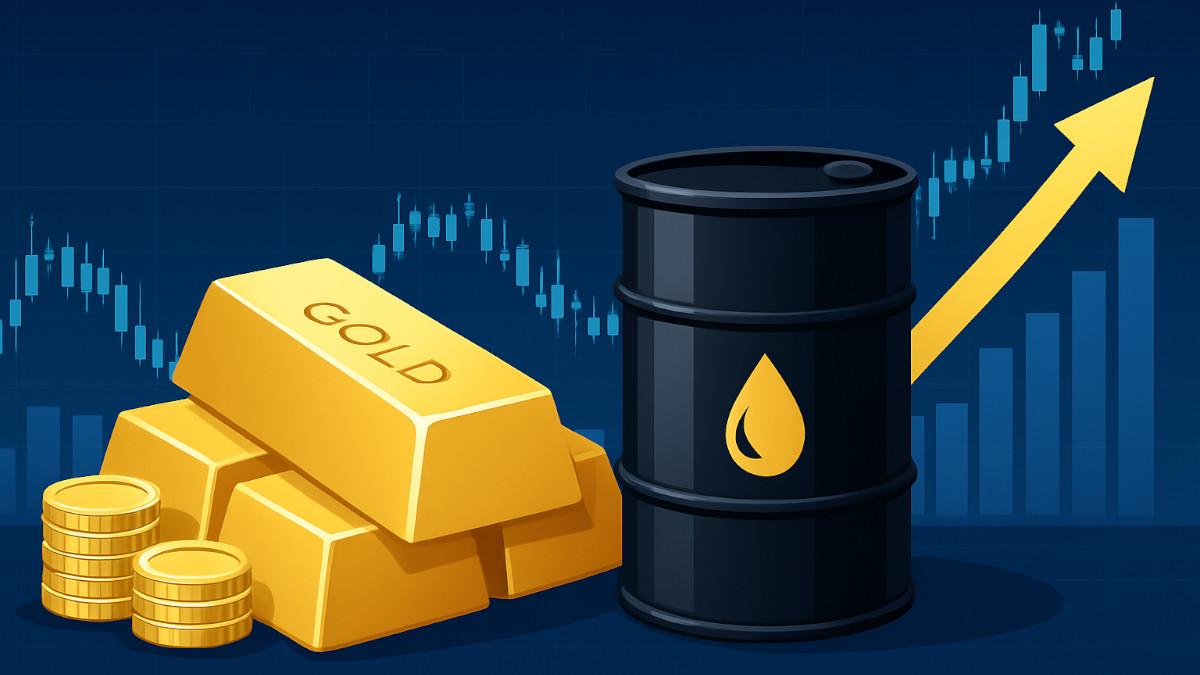
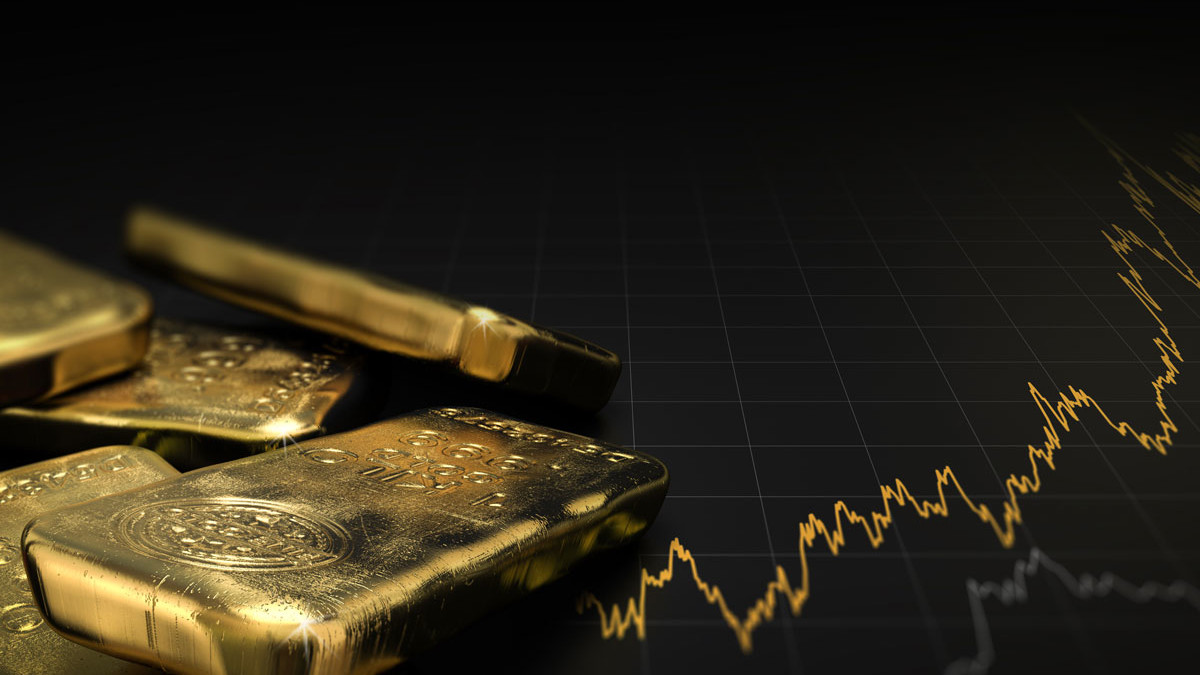
- Prezzi di Metalli Preziosi
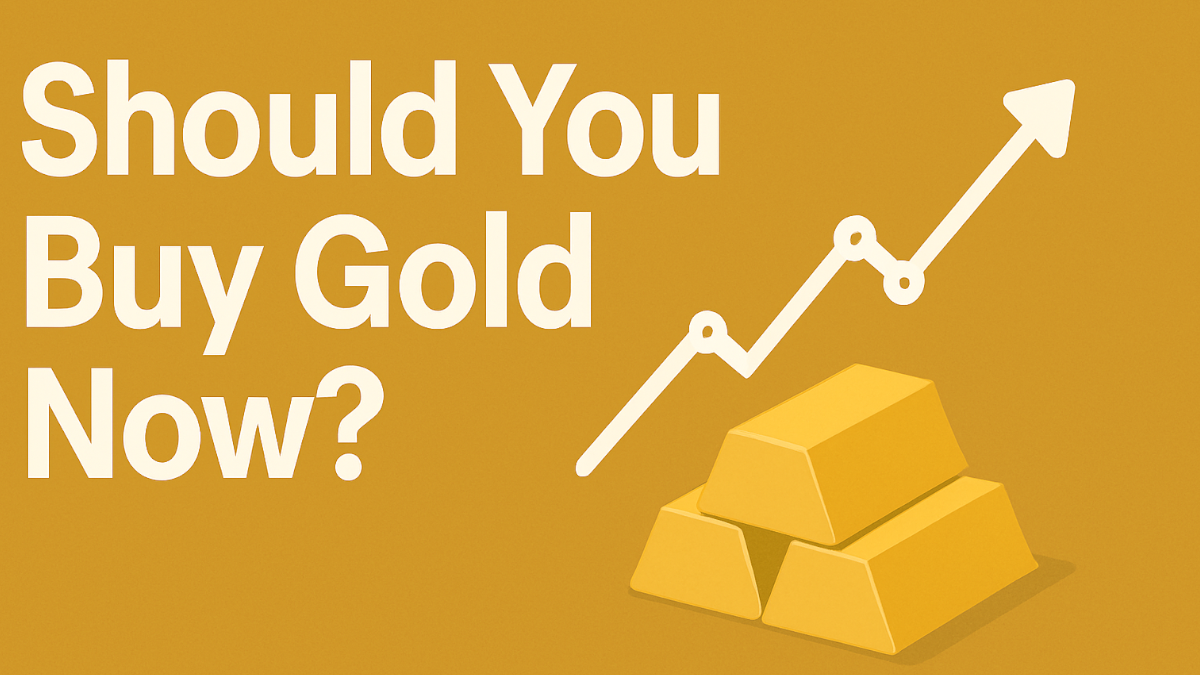
- Quotazione Oro Oggi
Quotazione Oro in Tempo Reale - Grafico Oro in Dollari (XAUUSD)
Questa pagina comprende tutte le informazioni di Oro, compresi i Oro grafici in tempo reale e dinamiche sul grafico scegliendo uno dei 8 disponibili cornici di tempo.
Spostando l'inizio e la fine dei tempi nel pannello in basso è possibile vedere sia l'attuali che storici movimenti di prezzo dello strumento. Inoltre, c'è l'opportunità di scegliere il tipo di visualizzazione del Oro grafico in tempo reale – Le candele o le Linee del grafico – attraverso i bottoni in alto a sinistra del grafico. Tutti i clienti che non hanno ancora deciso quale strumento scegliere per il trading, sono nel posto giusto, poiché leggendo le caratteristiche del XAUUSD e guardando le sue prestazioni sui grafici, li aiuterà a prendere la decisione finale.
È facile trovare un qualsiasi strumento, dal momento che ha un filtro per tutti i tipi di strumenti, offerti da IFC Markets, una volta il tipo viene scelto, l'elenco di tutti gli strumenti può essere visto proprio accanto al filtro.
Prezzi Oro in Dollari

Quotazione Oro Oggi
- 1m
- 5m
- 15m
- 30m
- 1h
- 4h
- 1g
- 1sett
Prezzo Spot di Oro Oggi
A partire da 11/07/2026, un'oncia di Oro costa $4107.76. Il prezzo al grammo è pari a $132.07, mentre il prezzo al chilo è di $132067.55. Il prezzo di Oro non si ferma mai, pertanto consideri questa come la Sua lettura attuale del mercato.
| Prezzi spot dell'Oro | Prezzo spot dell'Oro oggi |
|---|---|
| Prezzo del Oro per oncia | 4,107.76 |
| Prezzo del Oro al grammo | 132.07 |
| Prezzo del Oro al chilogrammo | 132,067.55 |
FAQs
what is Gold Spot Price Today?
The Gold Spot Price Today is $4107.760.
What are the main factors affecting the Gold Spot Price?
Gold's price is shaped by US dollar strength, interest rate policy, inflation expectations, and geopolitical risk. Since gold is priced in dollars, a weaker dollar tends to push gold higher, while a stronger dollar weighs on it. Because gold pays no yield, rising interest rates often reduce its appeal relative to interest-bearing assets, while falling rates tend to support demand.
Gold also acts as a safe-haven asset during periods of war, financial instability, or economic uncertainty, and central bank buying activity adds further demand pressure. These factors often interact, which is why gold prices can move sharply even within a single session - making it important for traders to track economic data and global events alongside the live price chart.
How is the XAUUSD Price quoted?
XAUUSD reflects the price of one troy ounce of gold (XAU) quoted in US dollars (USD). A quote of, say, $4107.760 means one ounce of gold is currently valued at that amount.
As a continuously updated real-time price, XAUUSD moves throughout the trading day based on global supply and demand. Trading XAUUSD as a CFD allows traders to speculate on gold's price direction without holding the physical metal. Because gold trades nearly around the clock across global financial centers, its price can shift outside typical regional hours, especially around major economic data releases — which is why monitoring the live quote alongside daily highs, lows, and the opening price gives useful context for current price action.
What chart time frames are available for Gold analysis?
IFC Markets offers the XAUUSD live chart across 8 time frames: 1 minute, 5 minutes, 15 minutes, 30 minutes, 1 hour, 4 hours, 1 day, and 1 week. This range supports a variety of trading styles.
Shorter intervals like 1-minute and 5-minute charts suit intraday or scalping strategies focused on rapid price moves. Mid-range time frames such as 1-hour and 4-hour charts are commonly used by swing traders holding positions over several days. Daily and weekly charts help longer-term traders and investors filter out short-term noise and focus on the broader trend. Many traders combine several time frames — using a daily chart for overall direction and a shorter one to refine entry timing.
Analisi Tecnica
L'analisi tecnica è un metodo di studio e di valutazione del comportamento del mercato in base allo storico prezzi. Il mio obiettivo principale è quello di prevedere la dinamica dei prezzi di uno strumento finanziario in futuro attraverso strumenti di analisi tecnica. Gli analisti tecnici utilizzano questo metodo di analisi di mercato per prevedere i prezzi delle diverse valute e coppie di valute. Questo tipo di analisi consente di fare previsioni di mercato basata sullo studio della cronologia dei prezzi di strumenti di trading.
Vedi anche più recenti tecniche di analisi delle dinamiche dei prezzi dei XAUUSD: previsioni XAUUSD.
Oro Dollaro News