- Analisi
- Analisi Tecnica
FR 40 Analisi Tecnica - FR 40 Trading: 2019-11-07
Rising composite PMI bullish for FR40
Composite PMI in France rose in October. Will the FR40 stock index continue rising?
French economic data were positive on balance after slowing inflation report a week ago: French economy advanced 0.3 percent on quarter in the three months to September 2019, the same pace as in the previous two quarters but above forecast of a 0.2 percent growth, and while retail sales growth slowed in September private sector expansion accelerated in October. Retail sales grew 4.1% over year in September after 4.2% growth in August, while both manufacturing and services sectors PMI’s rose contributing to increase in composite PMI to 52.6 from 50.8 in September. Readings above 50 indicate expansion. Accelerating private sector activity is bullish for French equities index.
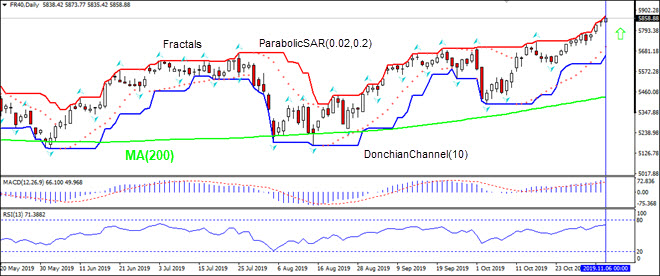
On the daily timeframe FR40: D1 is rising above the 200-day moving average MA(200) which is still rising.
- The Donchian channel indicates uptrend: it is tilted up.
- The Parabolic indicator has formed a buy signal.
- The MACD indicator is above the signal line and the gap is widening, this is bullish.
- The RSI oscillator is above 50 mark but has not reached the overbought zone.
We believe the bullish momentum will continue as the price breaches above the upper boundary of Donchian channel at 5847.51. This level can be used as an entry point for placing a pending order to buy. The stop loss can be placed below the fractal low at 5610.36. After placing the order, the stop loss is to be moved every day to the next fractal low, following Parabolic signals. Thus, we are changing the expected profit/loss ratio to the breakeven point. If the price meets the stop loss level (5847.51) without reaching the order (5610.36), we recommend cancelling the order: the market has undergone internal changes which were not taken into account.
Technical Analysis Summary
| Order | Buy |
| Buy stop | Above 5847.51 |
| Stop loss | Below 5610.36 |
- Ottieni certificato

Note:
Questa panormaica è di carattere informativo-educativo e viene pubblicata gratuitamente. Tutti i dati compresi nella panoramica sono ottenuti da fonti pubbliche conosciute più o meno affidabili. Inoltre non c'è alcuna garanzia che le informazioni fornite siano precise e complete. Le panoramiche non vengono aggiornate. Tutta l'informazione in ciascuna panoramica, compresi indicatori, opinioni, grafici e o quant'altro, è fornita a scopo conoscitivo e non è un consiglio finanziario. Tutto il testo e qualsiasi delle sue parti, e anche i grafici non possono essere considerati un'offerta per effettuare un'operazione con un qualsiasi asset. IFC Markets e i suoi impiegati in alcun caso non sono responsabili per qualsiasi azione intrapresa sulla base delle informazioni contenute.
