- Analisi
- Analisi Tecnica
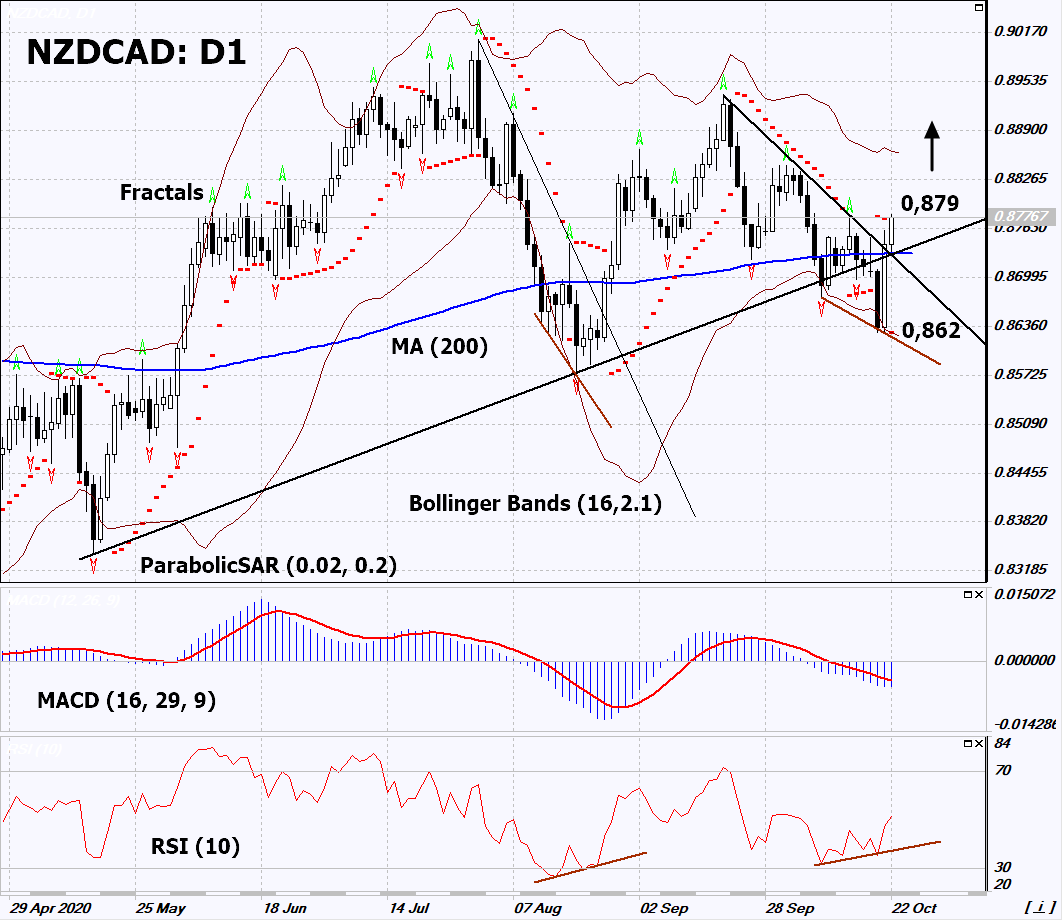
NZD/CAD Analisi Tecnica - NZD/CAD Trading: 2020-10-23
NZD/CAD Technical Analysis Summary
Sopra 0,879
Buy Stop
Sotto 0,862
Stop Loss
| Indicator | Signal |
| RSI | Buy |
| MACD | Sell |
| MA(200) | Buy |
| Fractals | Neutro |
| Parabolic SAR | Buy |
| Bollinger Bands | Neutro |
NZD/CAD Chart Analysis
NZD/CAD Analisi Tecnica
On the daily timeframe, NZDCAD: D1 exceeded the downtrend resistance line and the 200-day moving average line. A number of technical analysis indicators formed signals for further growth. We do not exclude a bullish move if NZDCAD rises above the last upper fractal: 0.879. This level can be used as an entry point. We can place a stop loss below the Parabolic signal and the lower Bollinger band: 0.862. After opening a pending order, we move the stop loss following the Bollinger and Parabolic signals to the next fractal low. Thus, we change the potential profit/loss ratio in our favor. After the transaction, the most risk-averse traders can switch to the 4-hour chart and set a stop loss, moving it in the direction of the bias. If the price meets the stop loss (0.862) without activating the order (0.879), it is recommended to delete the order: the market sustains internal changes that have not been taken into account.
Analisi Fondamentale Forex - NZD/CAD
For the entire time of the Covid-19 pandemic in New Zealand, 25 people died, and 1,914 people got infected. Will the NZDCAD quotes continue to grow?
The upward movement means the strengthening of the New Zealand dollar against the Canadian currency. New Zealand was hardly affected by the pandemic. To date, 41.3 million people worldwide have contracted the disease and 1.1 million people have died. In Canada, 210 thousand people fell ill and 10 thousand people died. The population of New Zealand is about 5 million people, and Canada - 38 million people. In Q2 this year, New Zealand experienced a deflation of -0.5% in quarterly terms. Investors believed this was a sign of an economic downturn. Investors are awaiting New Zealand inflation data for the 3rd quarter On Thursday. It is expected to rise by 0.9%, what can be positively perceived by market participants. The main risk for the Canadian dollar is a decrease in world oil prices and a possible monetary policy easing by the Bank of Canada.
Explore our
Trading Conditions
- Spreads from 0.0 pip
- 30,000+ Trading Instruments
- Stop Out Level - Only 10%
Ready to Trade?
Open Account Note:
Questa panormaica è di carattere informativo-educativo e viene pubblicata gratuitamente. Tutti i dati compresi nella panoramica sono ottenuti da fonti pubbliche conosciute più o meno affidabili. Inoltre non c'è alcuna garanzia che le informazioni fornite siano precise e complete. Le panoramiche non vengono aggiornate. Tutta l'informazione in ciascuna panoramica, compresi indicatori, opinioni, grafici e o quant'altro, è fornita a scopo conoscitivo e non è un consiglio finanziario. Tutto il testo e qualsiasi delle sue parti, e anche i grafici non possono essere considerati un'offerta per effettuare un'operazione con un qualsiasi asset. IFC Markets e i suoi impiegati in alcun caso non sono responsabili per qualsiasi azione intrapresa sulla base delle informazioni contenute.

