- Аналитика
- Технический Анализ
Nissan Технический Анализ - Nissan Трейдинг: 2025-05-29
NISSAN MOTOR CO., Ltd. Сводка Технического Анализа
выше 381.8
Buy Stop
ниже 349.9
Stop Loss
| Индикатор | Сигнал |
| RSI | Продать |
| MACD | Купить |
| Donchian Channel | Купить |
| MA(200) | Продать |
| Fractals | Купить |
| Parabolic SAR | Купить |
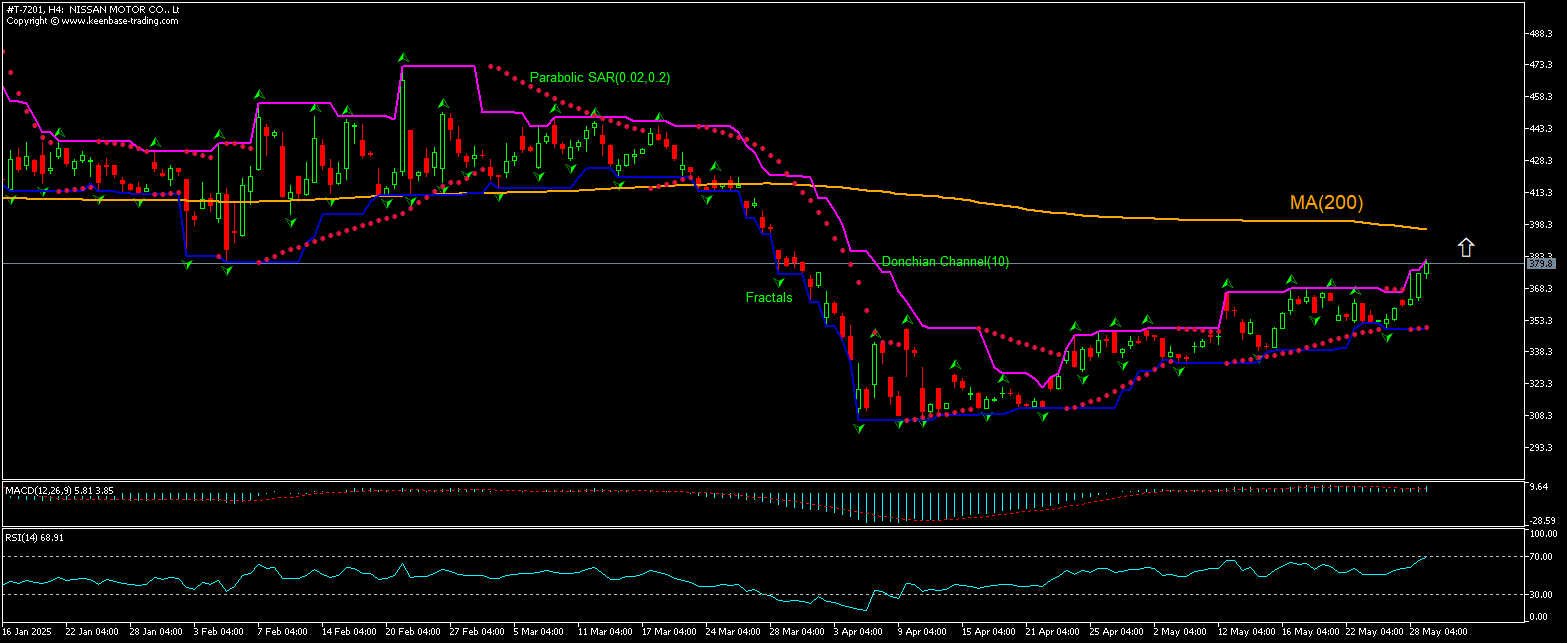
NISSAN MOTOR CO., Ltd. Графический анализ
NISSAN MOTOR CO., Ltd. Технический анализ
The technical analysis of the Nissan Motor stock price chart on 4-hour timeframe shows #T-7201,H4 is rising to test the 200-period moving average MA(200) after rebound following retreat to all-time low seven weeks ago. RSI is about to enter overbought zone. We believe the bullish momentum will continue after the price breaches above the upper bound of the Donchian Channel at 381.80. This level can be used as an entry point for placing a pending order to buy. The stop loss can be placed below 349.90. After placing the order, the stop loss is to be moved every day to the next fractal low, following Parabolic indicator signals. Thus, we are changing the expected profit/loss ratio to the breakeven point. If the price meets the stop loss level (349.90) without reaching the order (381.80), we recommend cancelling the order: the market has undergone internal changes which were not taken into account.
Фундаментальный Анализ Акции - NISSAN MOTOR CO., Ltd.
Nissan stock advanced after news the car makers offers buyouts to US workers. Will the Nissan Motor stock price continue rebounding?
Nissan Motor stock price rose after reports the company has started offering buyouts to US workers. Nissan CEO announced a new round of cost cuts that include closing seven production sites globally and cutting 11,000 more jobs, taking its total planned workforce reduction to around 20,000. Separation packages are being offered to personnel at Canton plant in Mississippi. Japan's third-biggest automaker has also suspended merit-based pay increases globally for the current business year. While the expansion of cost-cutting measures proceeds against the background of declining operating profit margin in North America in the business year ended March even as the company sold more cars than a year earlier, expectations of lower costs are bullish for a company stock price.
Узнайте Наши
Условия Торговли
- Спреды от 0.0 пункта
- 30 000+ торговых инструментов
- Мгновенное исполнение
Готовы начать?
Открыть счёт Примечание:
Этот обзор носит исключительно информационно-познавательный характер и публикуется бесплатно. Все данные, содержащиеся в обзоре, получены из открытых источников, признаваемых более-менее достоверными. При этом не существует никаких гарантий, что указанная информация является полной и точной. В дальнейшем обзоры не обновляются. Вся информация в каждом обзоре, включая мнения, показатели, графики и всё остальное, предоставлена только в целях ознакомления, и не является финансовым советом или рекомендацией. Весь текст и его любую часть, а также графики нельзя рассматривать в качестве предложения совершать какие-либо сделки с любыми активами. Компания IFC Markets и её сотрудники ни при каких обстоятельствах не несут никакой ответственности за любые действия предпринятые кем бы то ни было после или в ходе ознакомления с обзором.

